Pershing Square Activist Presentation Deck
C. McOpCo Financial Analysis
(U.S. $ in millions)
Income Statement Data
Revenue
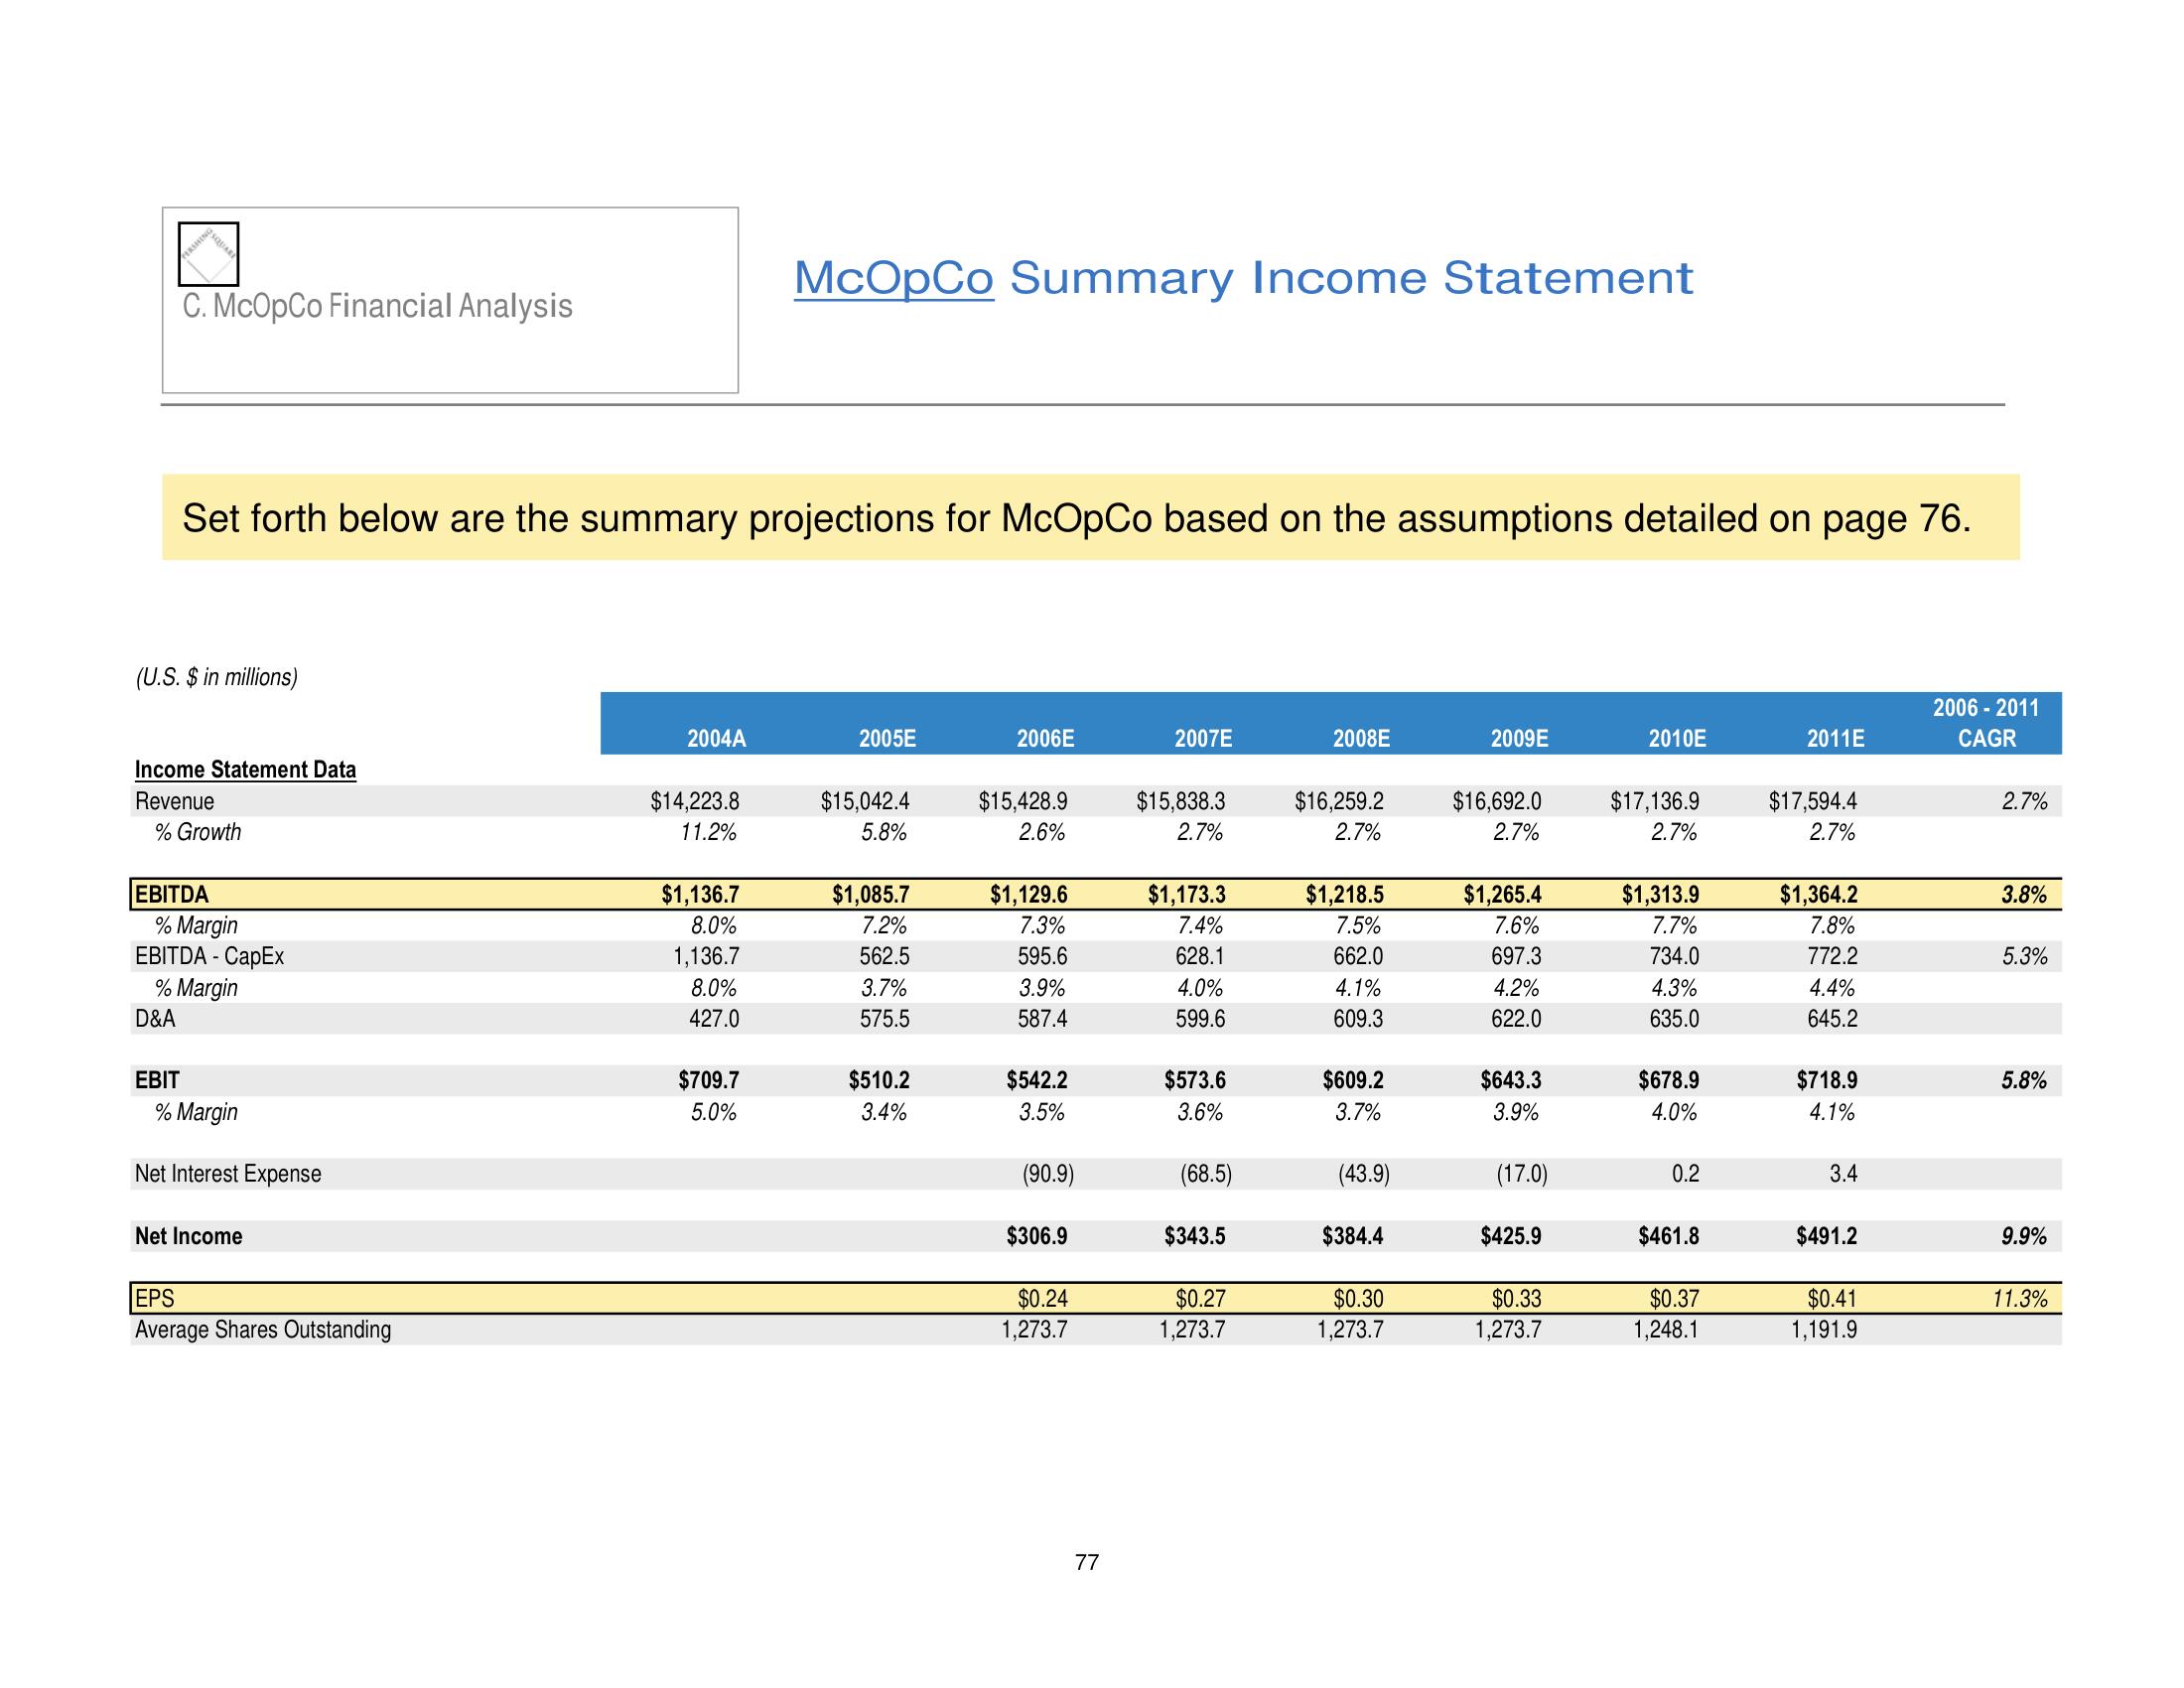
Set forth below are the summary projections for McOpCo based on the assumptions detailed on page 76.
% Growth
EBITDA
% Margin
EBITDA - CapEx
D&A
% Margin
EBIT
% Margin
Net Interest Expense
Net Income
EPS
Average Shares Outstanding
2004A
$14,223.8
11.2%
$1,136.7
8.0%
1,136.7
8.0%
427.0
McOpCo Summary Income Statement
$709.7
5.0%
2005E
$15,042.4
5.8%
$1,085.7
7.2%
562.5
3.7%
575.5
$510.2
3.4%
2006E
$15,428.9
2.6%
$1,129.6
7.3%
595.6
3.9%
587.4
$542.2
3.5%
(90.9)
$306.9
$0.24
1,273.7
77
2007E
$15,838.3
2.7%
$1,173.3
7.4%
628.1
4.0%
599.6
$573.6
3.6%
(68.5)
$343.5
$0.27
1,273.7
2008E
$16,259.2
2.7%
$1,218.5
7.5%
662.0
4.1%
609.3
$609.2
3.7%
(43.9)
$384.4
$0.30
1,273.7
2009E
$16,692.0
2.7%
$1,265.4
7.6%
697.3
4.2%
622.0
$643.3
3.9%
(17.0)
$425.9
$0.33
1,273.7
2010E
$17,136.9
2.7%
$1,313.9
7.7%
734.0
4.3%
635.0
$678.9
4.0%
0.2
$461.8
$0.37
1,248.1
2011E
$17,594.4
2.7%
$1,364.2
7.8%
772.2
4.4%
645.2
$718.9
4.1%
3.4
$491.2
$0.41
1,191.9
2006 - 2011
CAGR
2.7%
3.8%
5.3%
5.8%
9.9%
11.3%View entire presentation