Lyft Results Presentation Deck
Key Highlights
Q1'22
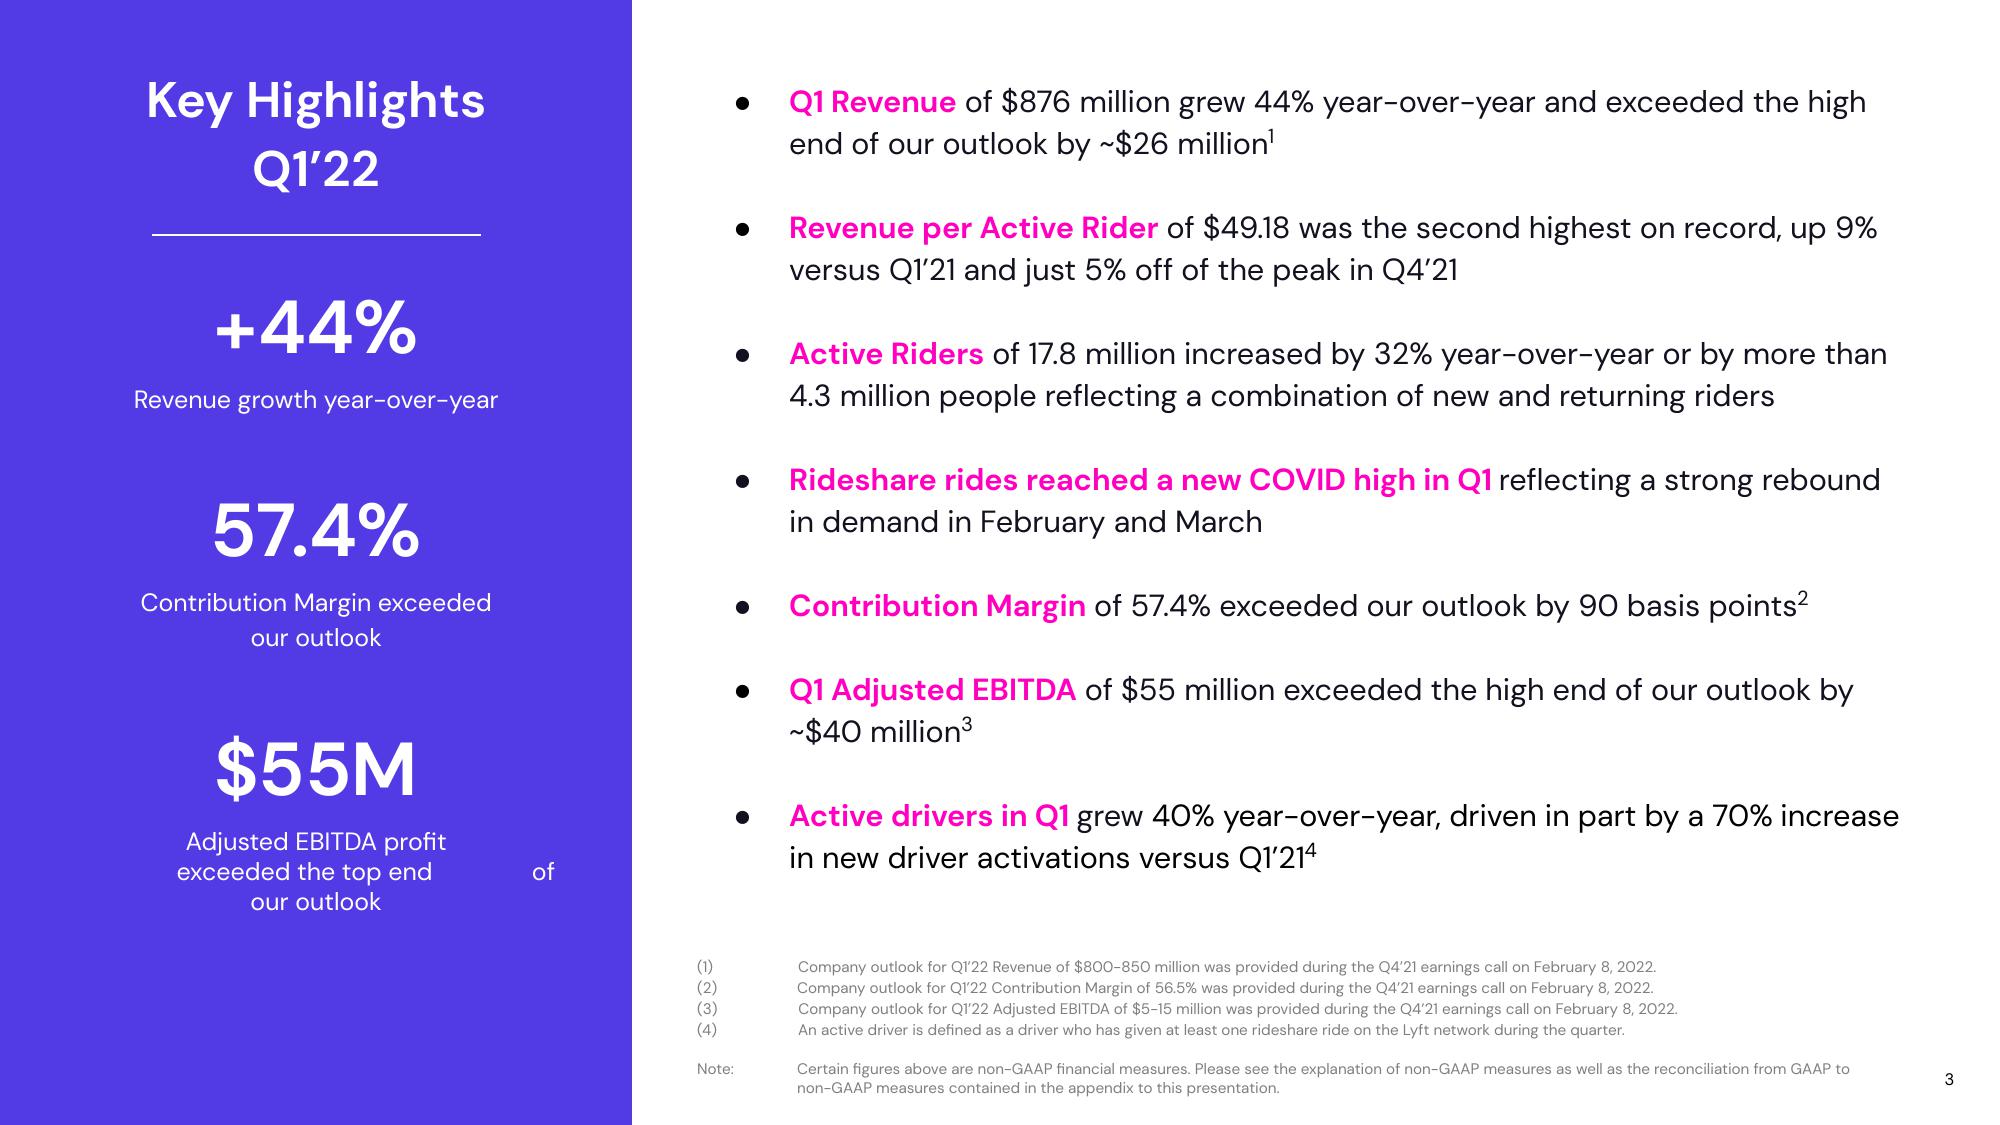
+44%
Revenue growth year-over-year
57.4%
Contribution Margin exceeded
our outlook
$55M
Adjusted EBITDA profit
exceeded the top end
our outlook
of
(1)
(2)
(3)
(4)
Note:
Q1 Revenue of $876 million grew 44% year-over-year and exceeded the high
end of our outlook by ~$26 million¹
Revenue per Active Rider of $49.18 was the second highest on record, up 9%
versus Q1'21 and just 5% off of the peak in Q4'21
Active Riders of 17.8 million increased by 32% year-over-year or by more than
4.3 million people reflecting a combination of new and returning riders
Rideshare rides reached a new COVID high in Q1 reflecting a strong rebound
in demand in February and March
Contribution Margin of 57.4% exceeded our outlook by 90 basis points²
Q1 Adjusted EBITDA of $55 million exceeded the high end of our outlook by
~$40 million³
Active drivers in Q1 grew 40% year-over-year, driven in part by a 70% increase
in new driver activations versus Q1'214
Company outlook for Q1'22 Revenue of $800-850 million was provided during the Q4'21 earnings call on February 8, 2022.
Company outlook for Q1'22 Contribution Margin of 56.5% was provided during the Q4'21 earnings call on February 8, 2022.
Company outlook for Q1'22 Adjusted EBITDA of $5-15 million was provided during the Q4'21 earnings call on February 8, 2022.
An active driver is defined as a driver who has given at least one rideshare ride on the Lyft network during the quarter.
Certain figures above are non-GAAP financial measures. Please see the explanation of non-GAAP measures as well as the reconciliation from GAAP to
non-GAAP measures contained in the appendix to this presentation.
3View entire presentation