Cerberus Global NPL Fund, L.P.
1 Strong Downside Protection
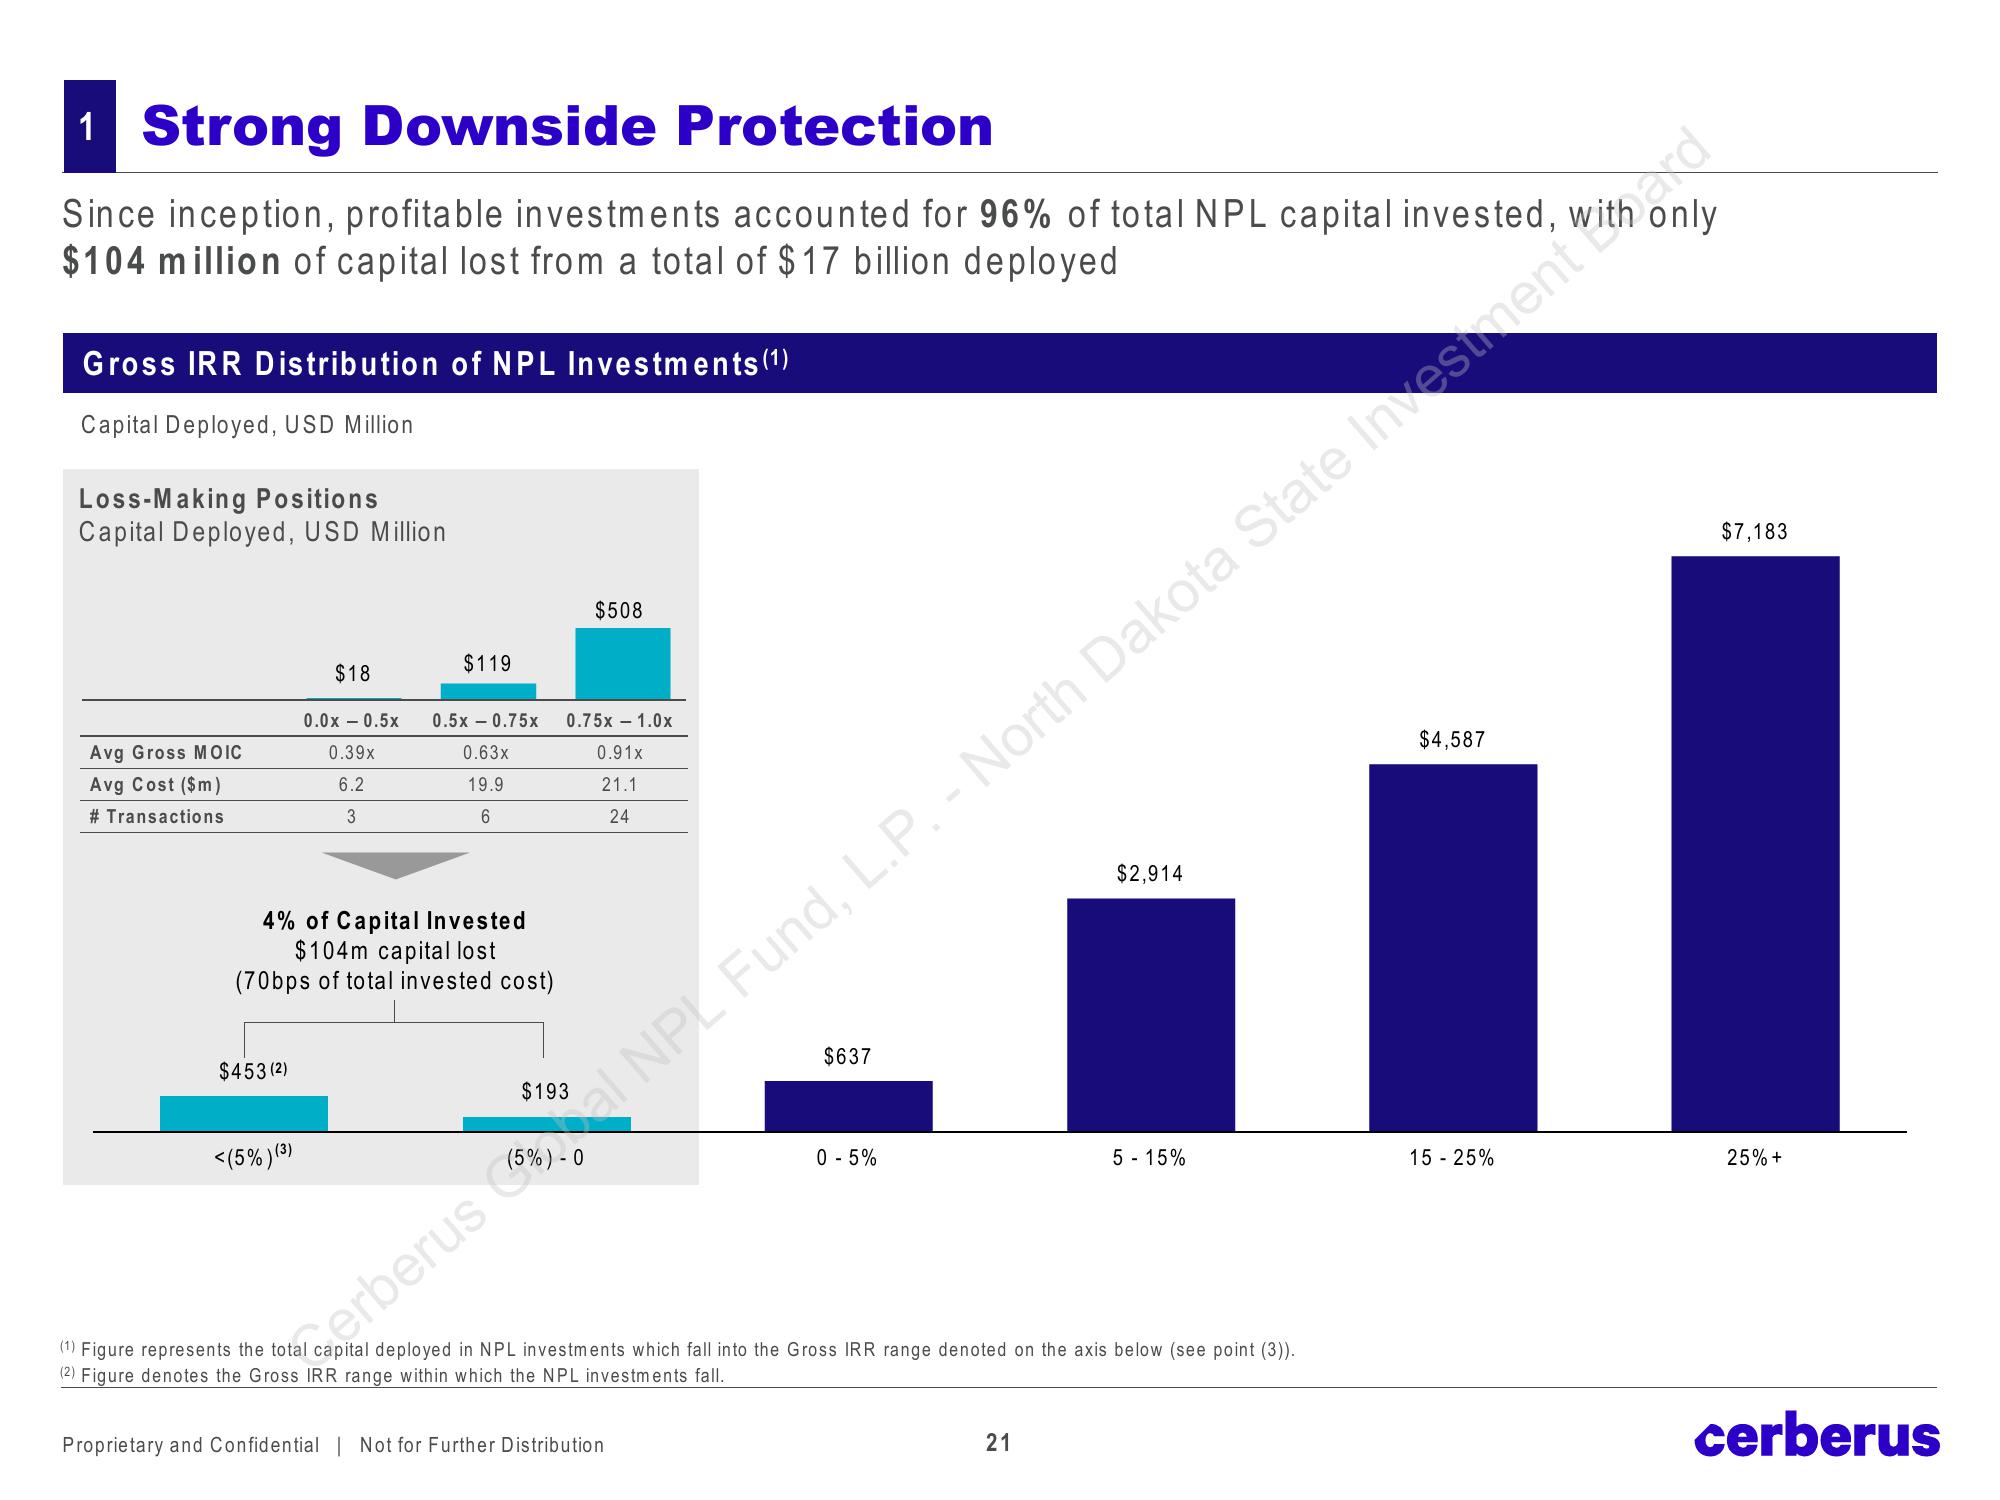
Since inception, profitable investments accounted for 96% of total NPL capital invested,
$104 million of capital lost from a total of $17 billion deployed
Gross IRR Distribution of NPL Investments (1)
Capital Deployed, USD Million
Loss-Making Positions
Capital Deployed, USD Million
Avg Gross MOIC
Avg Cost ($m)
# Transactions
$453 (2)
$18
<(5%) (3)
0.0x -0.5x
0.39x
6.2
3
$119
4% of Capital Invested
$104m capital lost
(70bps of total invested cost)
0.5x -0.75x
0.63x
19.9
6
$508
0.75x-1.0x
0.91x
21.1
24
$637
0 - 5%
Proprietary and Confidential | Not for Further Distribution
$2,914
5-15%
(1) Figure represents the total capital deployed in NPL investments which fall into the Gross IRR range denoted on the axis below (see point (3)).
(2) Figure denotes the Gross IRR range within which the NPL investments fall.
21
$4,587
15 - 25%
only
erberus al NPL Fund, L.P. - North Dakota State Investment with
$7,183
25% +
cerberusView entire presentation