OnesSpaWorld SPAC
EXCEPTIONALLY STRONG CASH FLOWS AND
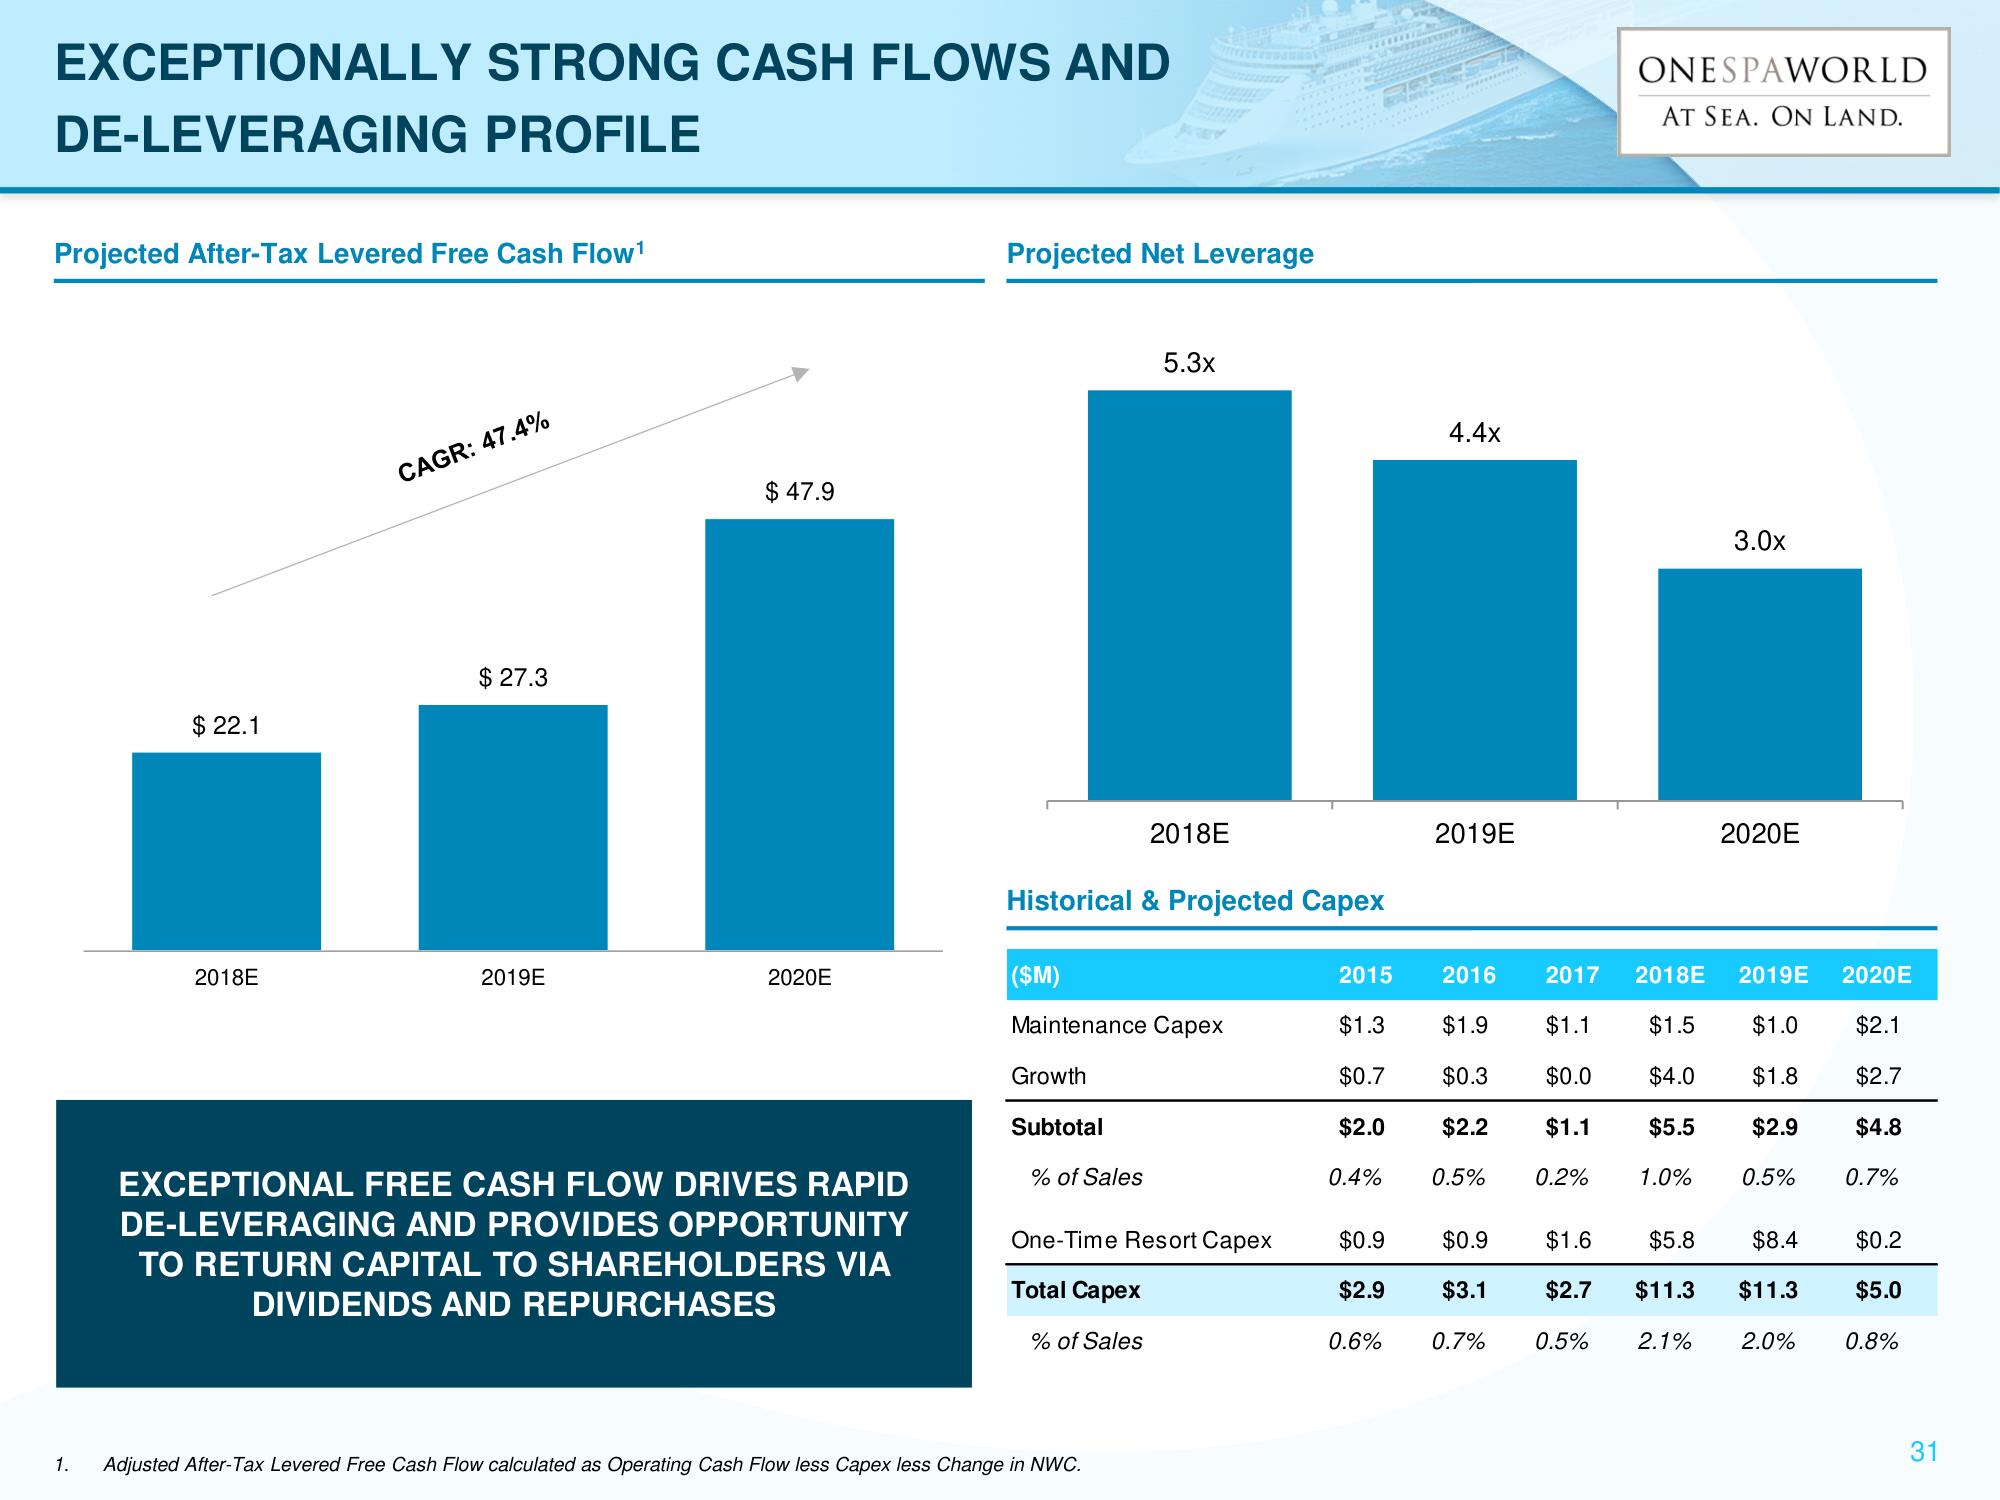
DE-LEVERAGING PROFILE
Projected After-Tax Levered Free Cash Flow¹
$22.1
2018E
CAGR: 47.4%
$ 27.3
2019E
$ 47.9
2020E
EXCEPTIONAL FREE CASH FLOW DRIVES RAPID
DE-LEVERAGING AND PROVIDES OPPORTUNITY
TO RETURN CAPITAL TO SHAREHOLDERS VIA
DIVIDENDS AND REPURCHASES
Projected Net Leverage
Historical & Projected Capex
Growth
($M)
Maintenance Capex
Subtotal
5.3x
% of Sales
2018E
1. Adjusted After-Tax Levered Free Cash Flow calculated as Operating Cash Flow less Capex less Change in NWC.
One-Time Resort Capex
Total Capex
% of Sales
2015
$1.3
$0.7
$2.0
0.4%
$0.9
$2.9
0.6%
4.4x
2019E
0.5%
$0.9
$3.1
0.7%
ONESPAWORLD
AT SEA. ON LAND.
2016 2017 2018E 2019E
$1.9
$1.1 $1.5
$1.0
$0.3
$0.0
$4.0
$1.8
$2.2
$1.1
$5.5
$2.9
0.2%
1.0%
0.5%
3.0x
0.5%
2020E
$1.6 $5.8
$8.4
$2.7 $11.3 $11.3
2.1% 2.0%
2020E
$2.1
$2.7
$4.8
0.7%
$0.2
$5.0
0.8%
31View entire presentation