Bank of America Results Presentation Deck
Global Markets Trends and Revenue Mix
Business Leadership¹
• Americas Derivatives House of the Year and
Americas House of the Year for Equity Derivatives,
FX Derivatives, Interest Rate Derivatives, and
Commodities Derivatives (R)
Interest Rate Derivatives House of the Year(s)
• Global Leader for Sustainable Project Finance()
• Overall Leader for North America in Sustainable
Finance(L)
No. 2 Global Research Firm(™)
• No. 2 Global Fixed Income Research Team(T)
Securitization Research Team of the Year)
• Most Impressive Corporate Bond House in Dollars(R)
No. 1 Municipal Bonds Underwriter(U)
$15.0
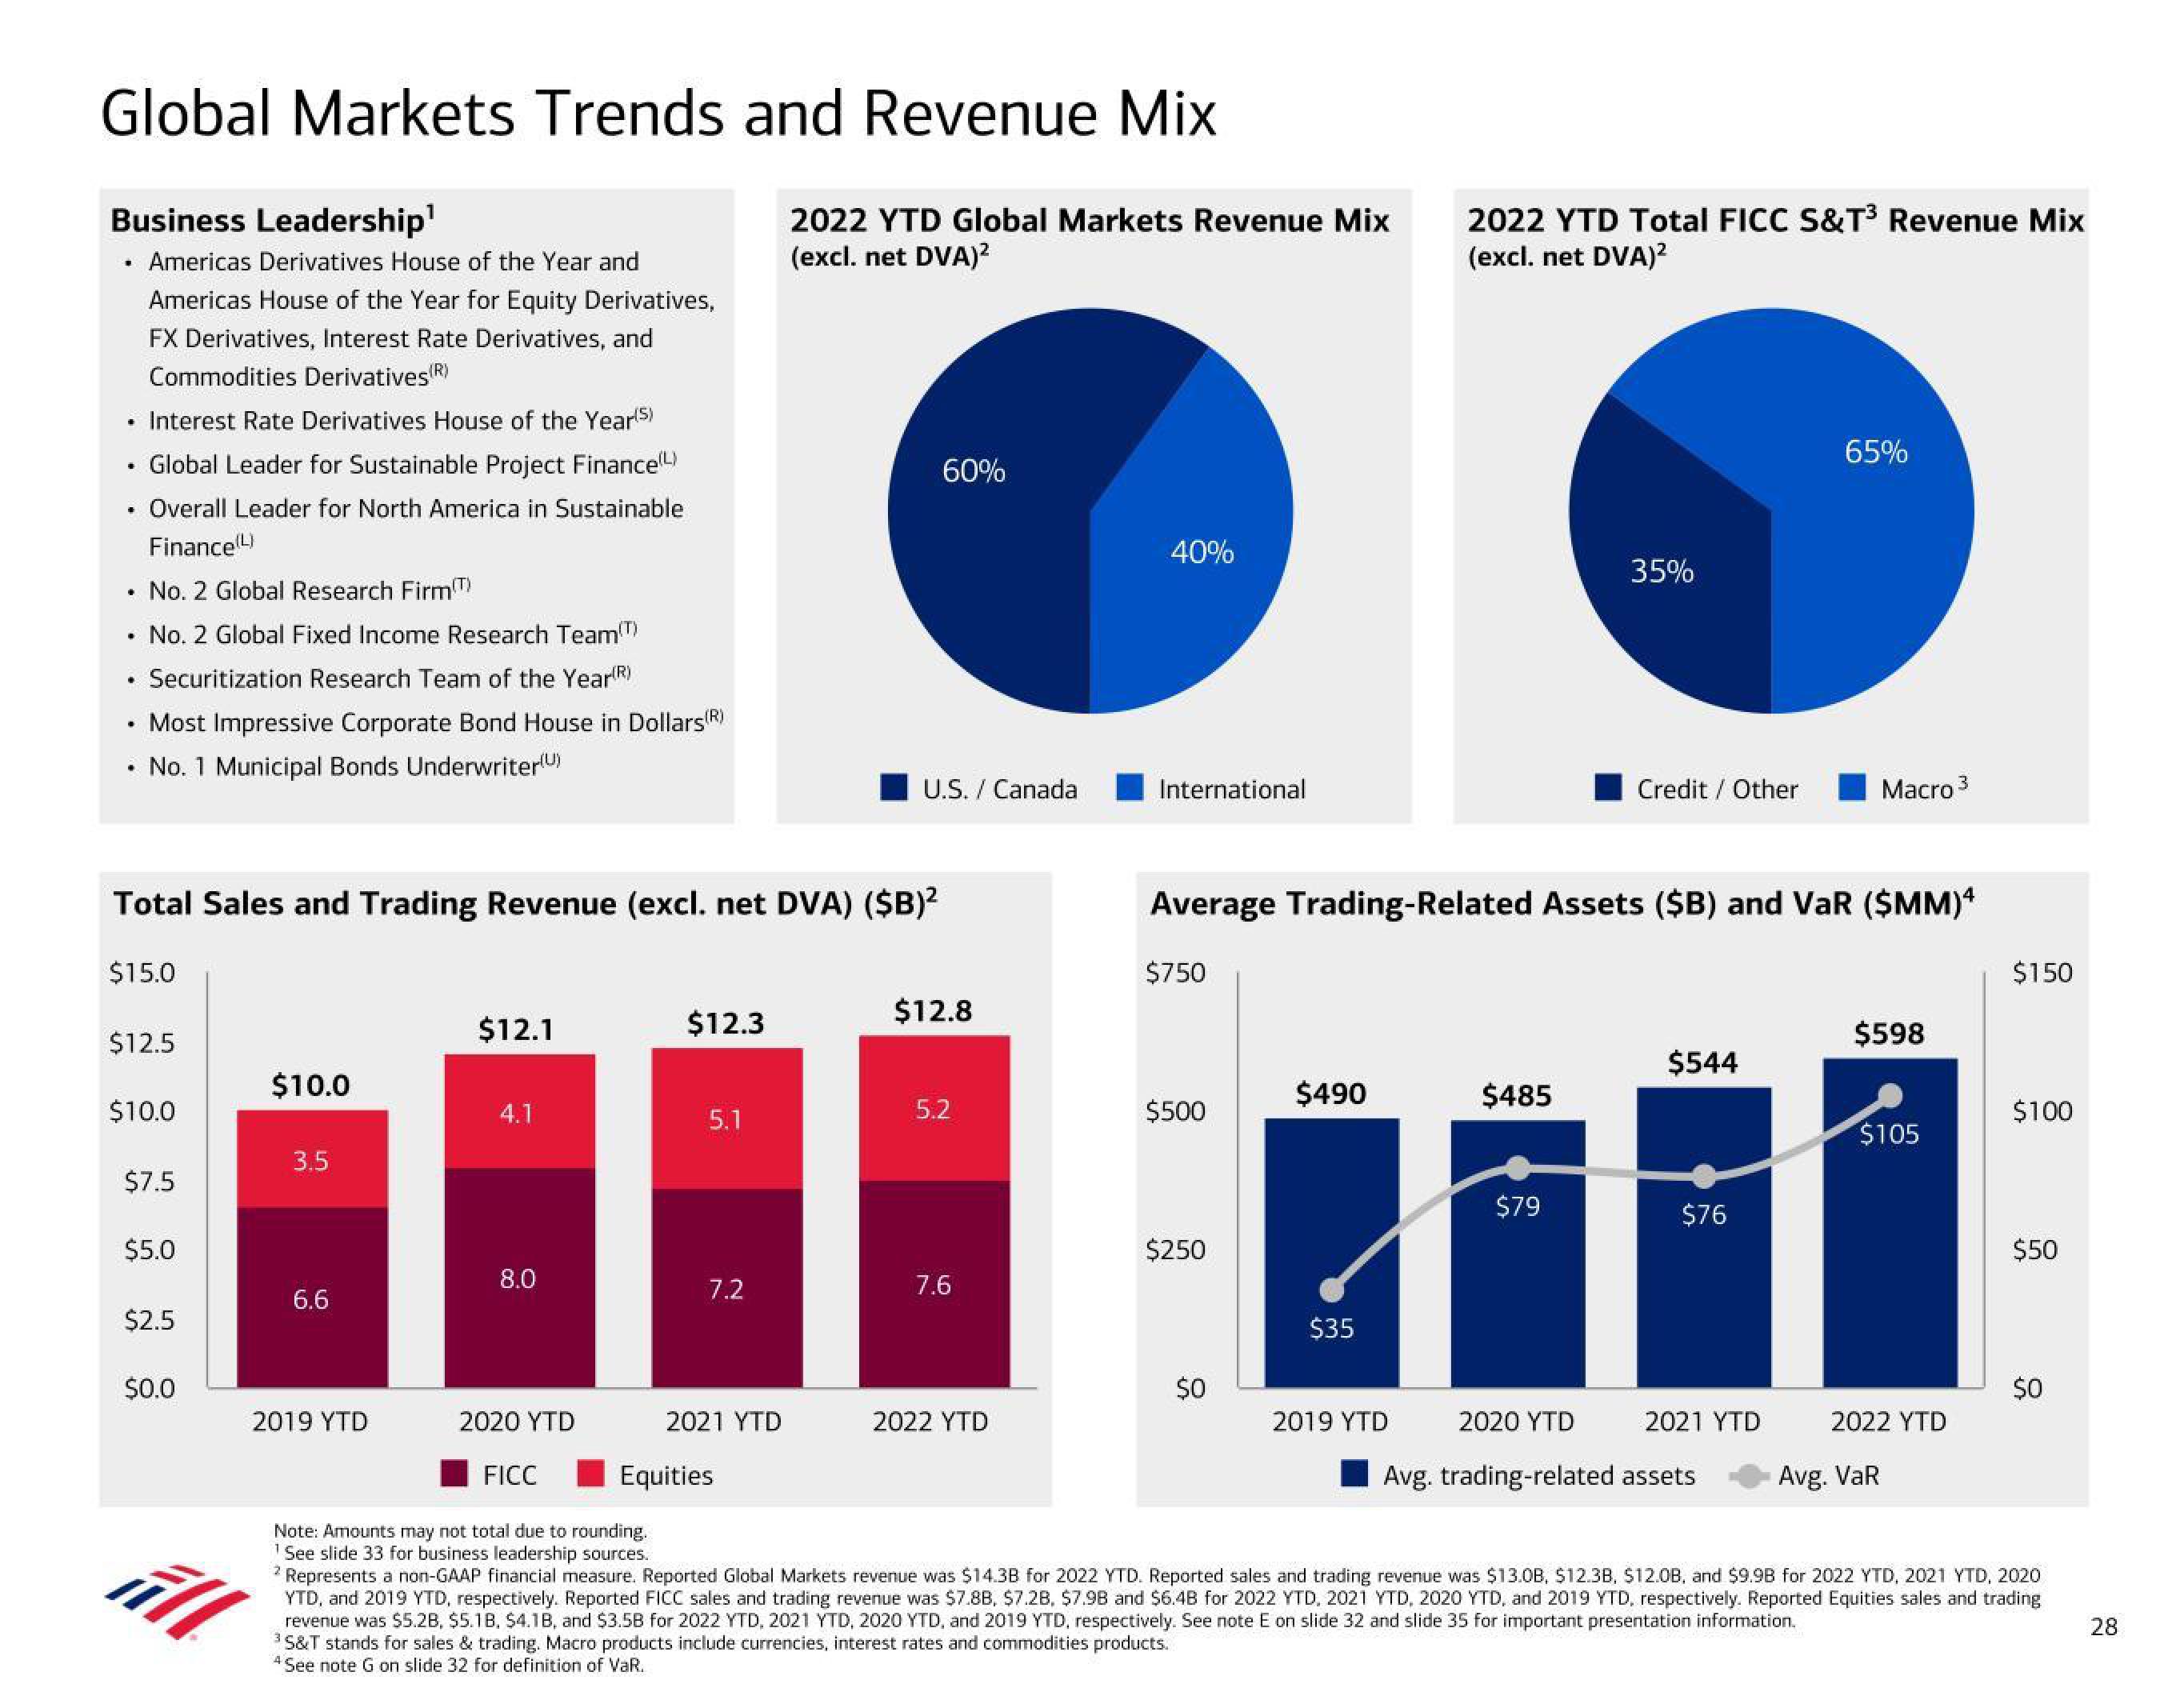
Total Sales and Trading Revenue (excl. net DVA) ($B)²
$12.5
$10.0
$7.5
$5.0
$2.5
$0.0
$10.0
3.5
6.6
$12.1
2019 YTD
4.1
8.0
2020 YTD
FICC
$12.3
5.1
Note: Amounts may not total due to rounding.
¹ See slide 33 for business leadership sources.
7.2
2022 YTD Global Markets Revenue Mix
(excl. net DVA)²
2021 YTD
Equities
60%
U.S. / Canada
$12.8
5.2
7.6
40%
2022 YTD
International
$750
$500
ill
2 Represents a non-GAAP financial measure. Reported Global Markets revenue was $14.3B for 2022 YTD. Reported sales and trading revenue was $13.0B, $12.3B, $12.0B, and $9.9B for 2022 YTD, 2021 YTD, 2020
YTD, and 2019 YTD, respectively. Reported FICC sales and trading revenue was $7.8B, $7.28, $7.9B and $6.4B for 2022 YTD, 2021 YTD, 2020 YTD, and 2019 YTD, respectively. Reported Equities sales and trading
revenue was $5.2B, $5.1B, $4.1B, and $3.5B for 2022 YTD, 2021 YTD, 2020 YTD, and 2019 YTD, respectively. See note E on slide 32 and slide 35 for important presentation information.
$250
Average Trading-Related Assets ($B) and VaR ($MM)4
S&T stands for sales & trading. Macro products include currencies, interest rates and commodities products.
4 See note G on slide 32 for definition of VaR.
$490
$0
2022 YTD Total FICC S&T³ Revenue Mix
(excl. net DVA)²
$35
2019 YTD
$485
35%
$79
Credit / Other
2020 YTD
$544
$76
65%
2021 YTD
Avg. trading-related assets
Macro 3
$598
$105
2022 YTD
Avg. VaR
$150
$100
$50
$0
28View entire presentation