Kore SPAC Presentation Deck
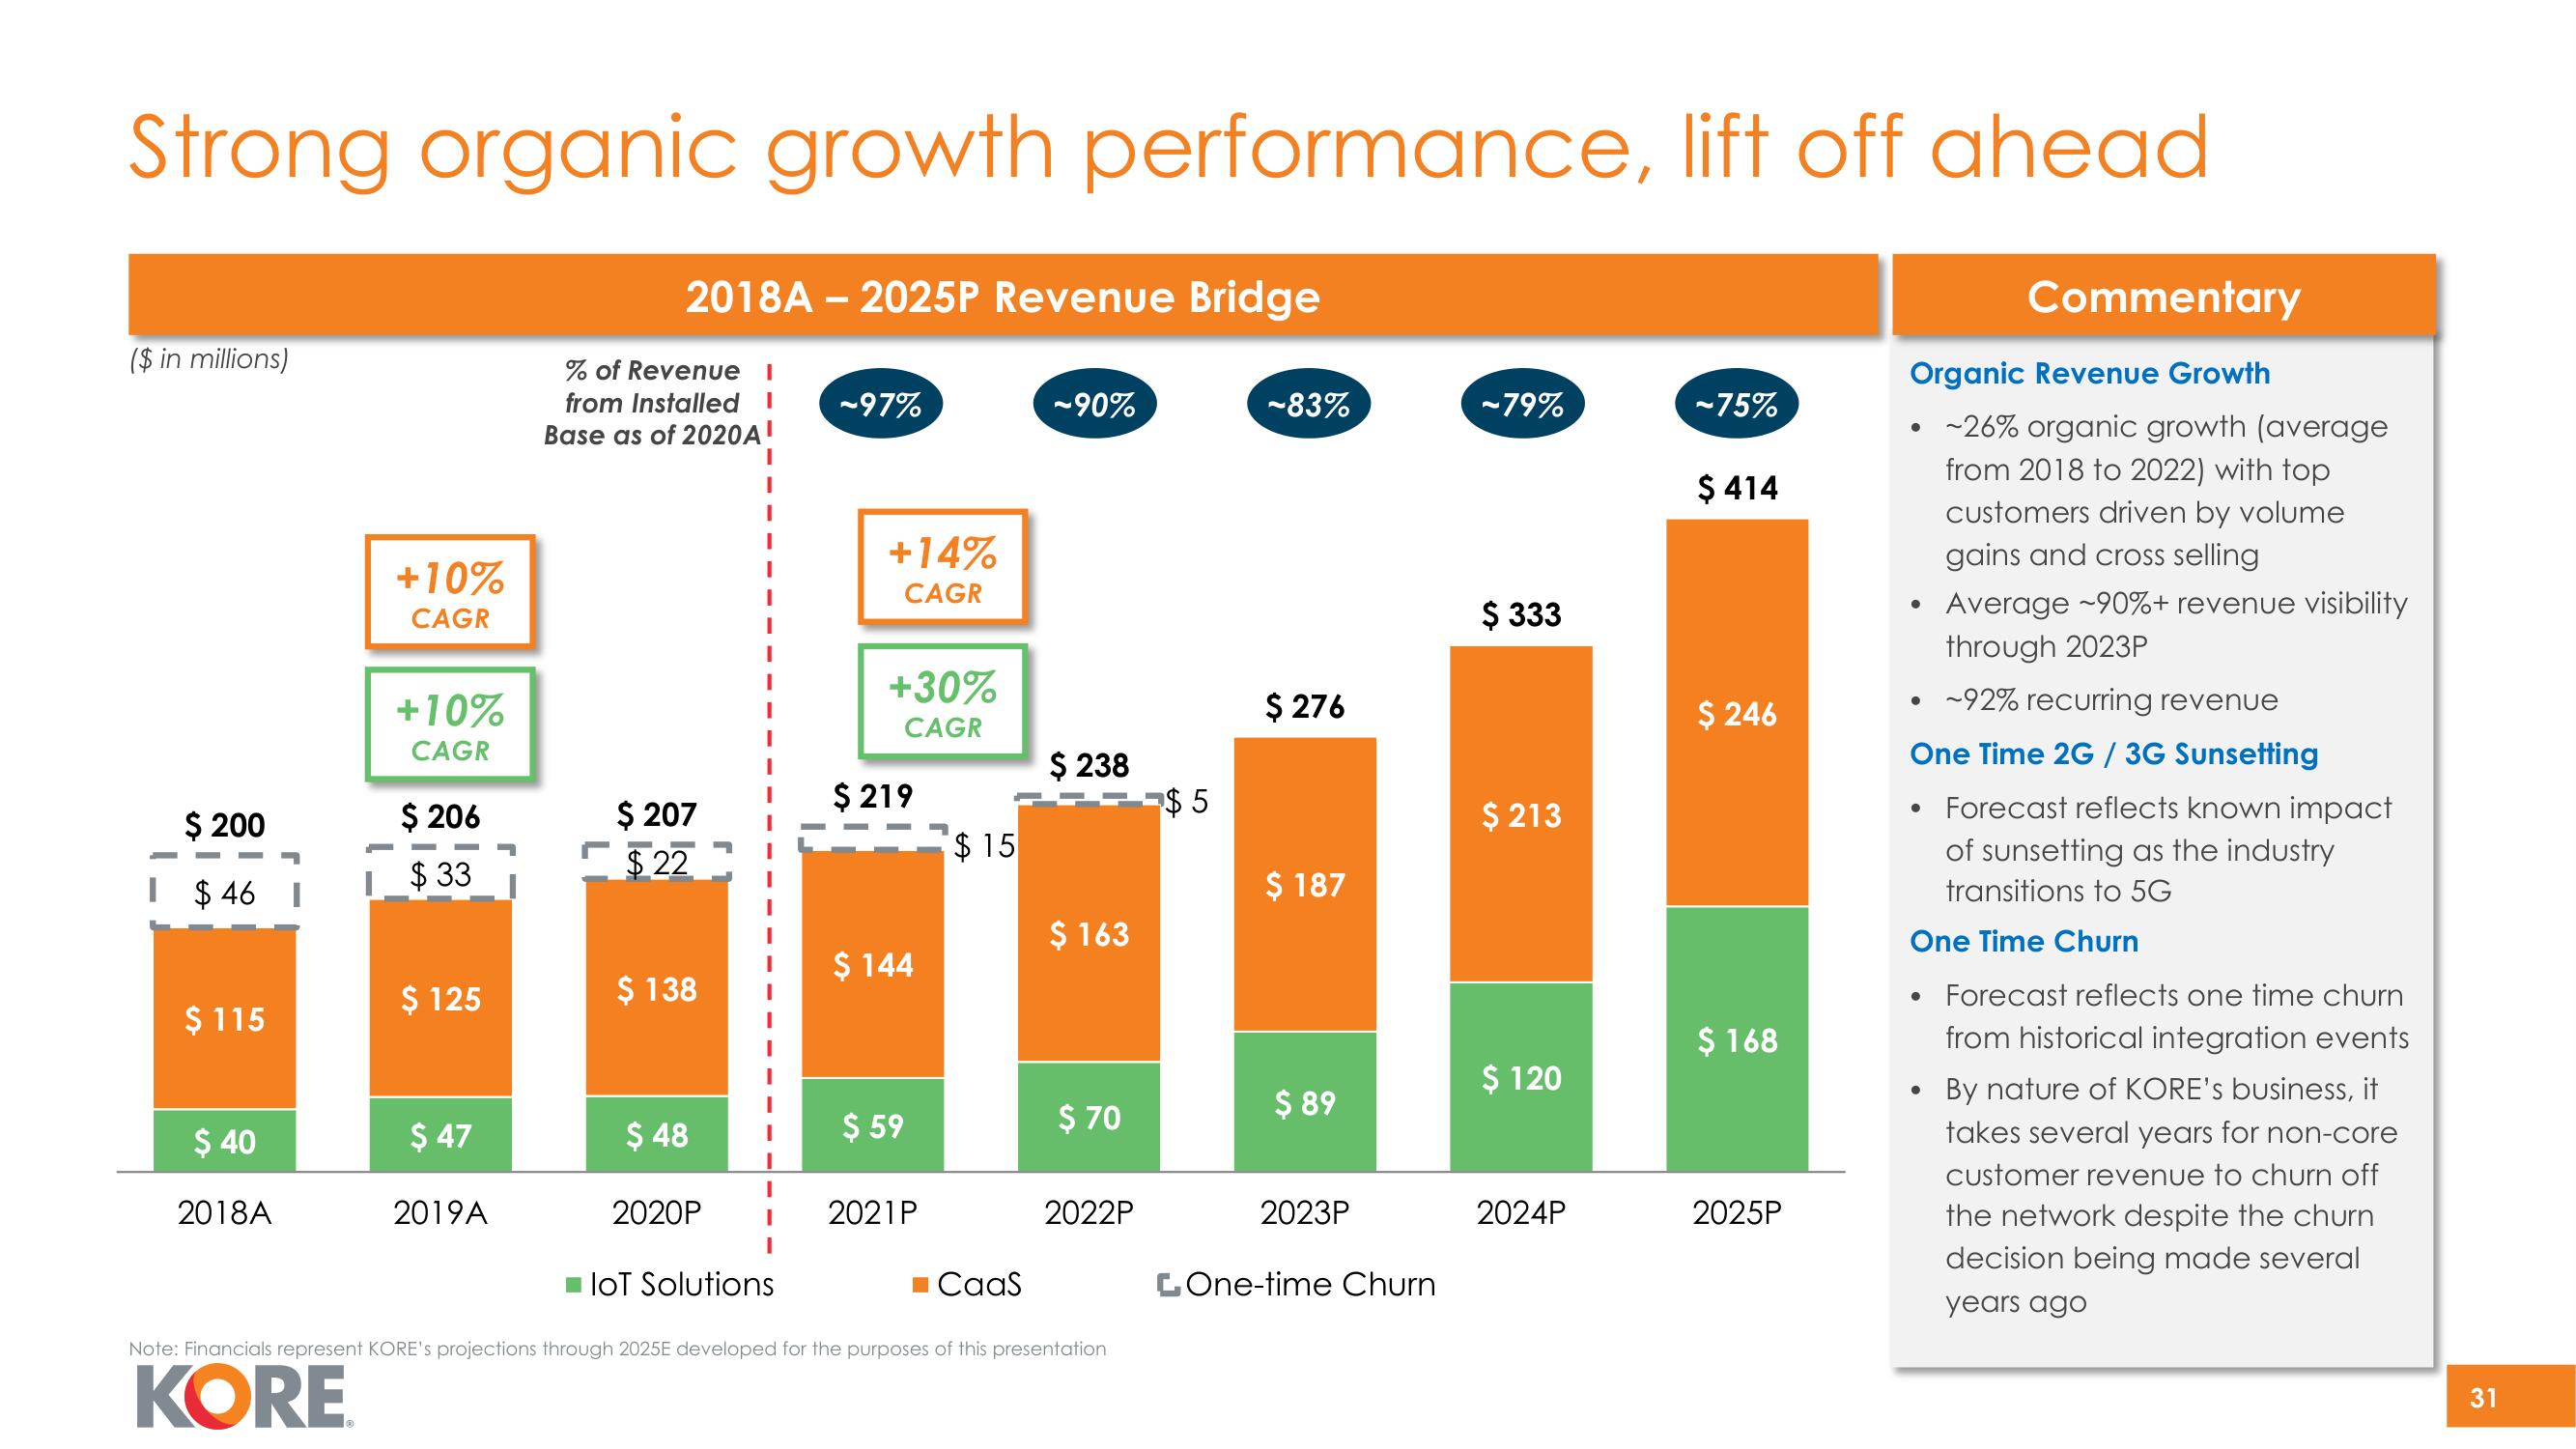
Strong organic growth performance, lift off ahead
($ in millions)
$ 200
$46
$ 115
$ 40
2018A
+10%
CAGR
+10%
CAGR
$ 206
$33
$ 125
$ 47
2019A
2018A - 2025P Revenue Bridge
% of Revenue I
from Installed
Base as of 2020A
$ 207
$22
$ 138
$ 48
2020P
IoT Solutions
-97%
+14%
CAGR
+30%
CAGR
$ 219
$ 144
$ 59
2021P
$15
■CaaS
~90%
$ 238
$ 163
$ 70
2022P
Note: Financials represent KORE's projections through 2025E developed for the purposes of this presentation
KORE
$5
-83%
$ 276
$ 187
$ 89
2023P
LOne-time Churn
-79%
$ 333
$ 213
$ 120
2024P
-75%
$ 414
$ 246
$ 168
2025P
Organic Revenue Growth
• ~26% organic growth (average
from 2018 to 2022) with top
●
Commentary
●
●
customers driven by volume
gains and cross selling
• ~92% recurring revenue
One Time 2G / 3G Sunsetting
Forecast reflects known impact
of sunsetting as the industry
transitions to 5G
One Time Churn
Average ~90%+ revenue visibility
through 2023P
Forecast reflects one time churn
from historical integration events
By nature of KORE's business, it
takes several years for non-core
customer revenue to churn off
the network despite the churn
decision being made several
years ago
31View entire presentation