Worthington Industries Mergers and Acquisitions Presentation Deck
NEW WORTHINGTON IS A MARKET LEADER WITH PREMIER
BRANDS IN ATTRACTIVE END MARKETS
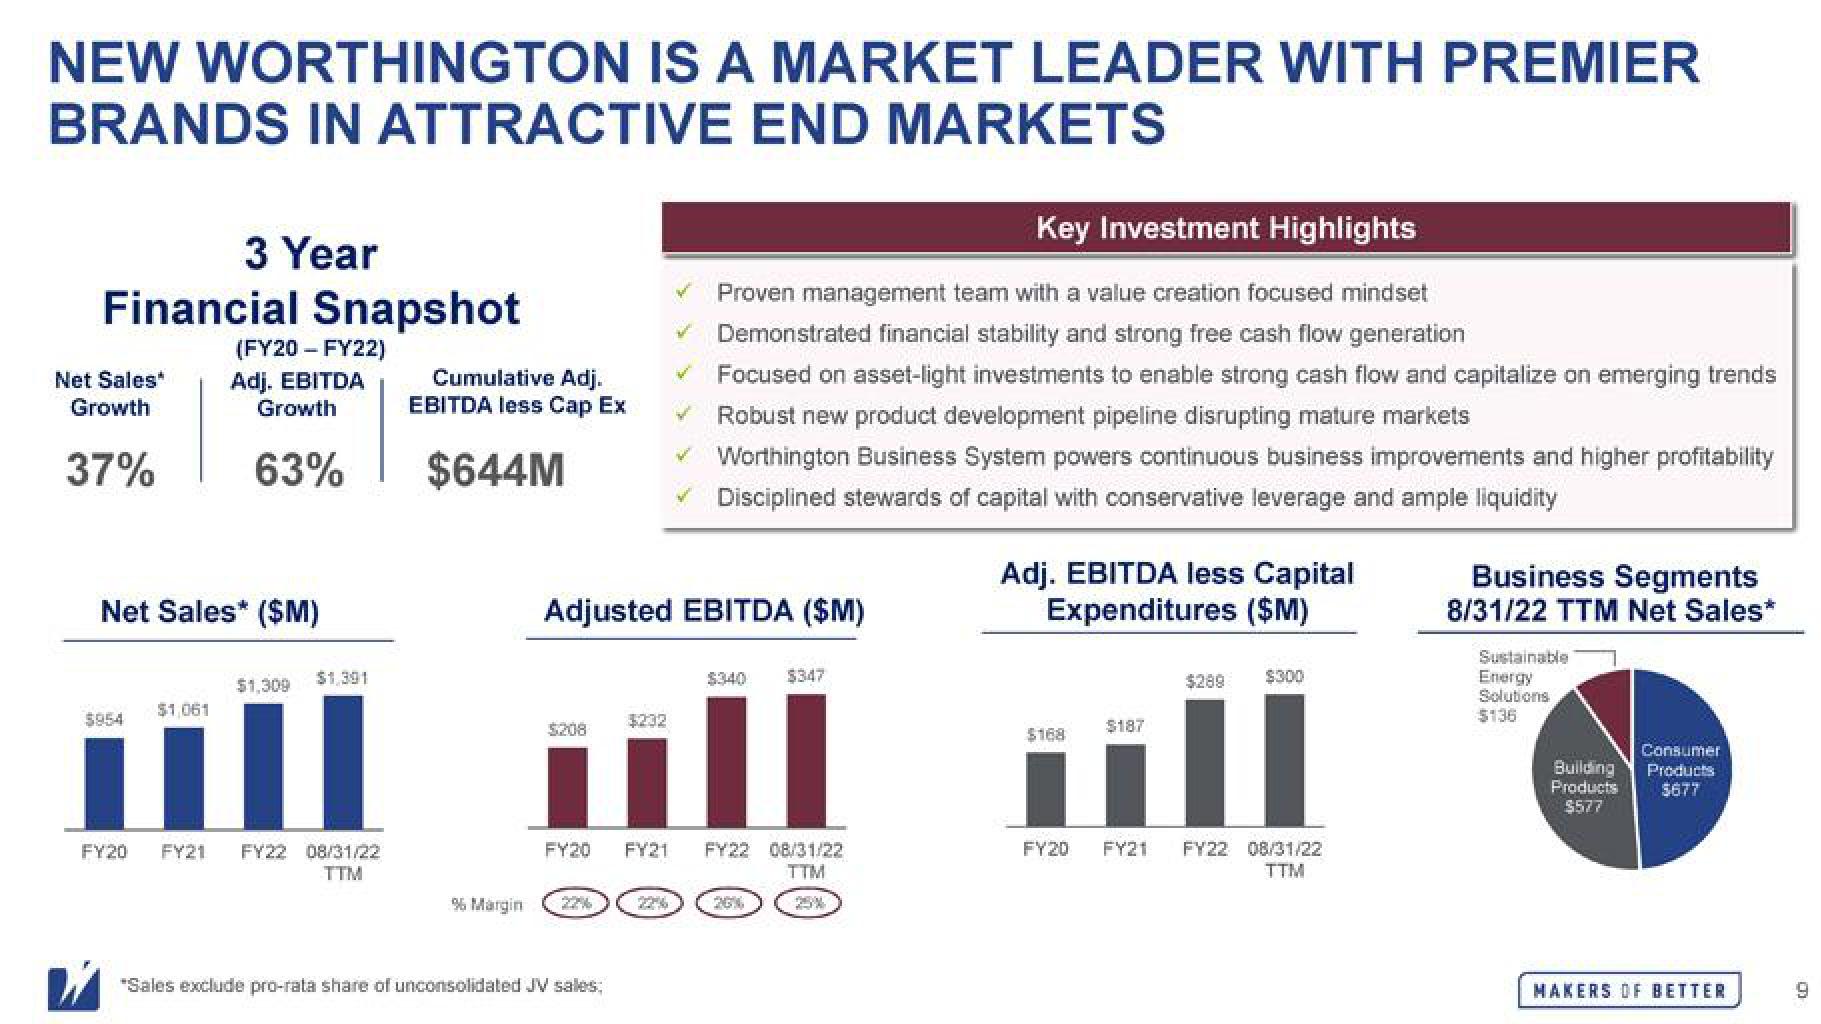
3 Year
Financial Snapshot
(FY20 - FY22)
Adj. EBITDA
Growth
63%
Net Sales*
Growth
37%
Net Sales* ($M)
$954
$1,061
$1,309
$1,391
FY20 FY21 FY22 08/31/22
TTM
Cumulative Adj.
EBITDA less Cap Ex
$644M
% Margin
$208
Adjusted EBITDA ($M)
Key Investment Highlights
B Proven management team with a value creation focused mindset
Demonstrated financial stability and strong free cash flow generation
Focused on asset-light investments to enable strong cash flow and capitalize on emerging trends
Robust new product development pipeline disrupting mature markets
Worthington Business System powers continuous business improvements and higher profitability
Disciplined stewards of capital with conservative leverage and ample liquidity
$232
*Sales exclude pro-rata share of unconsolidated JV sales;
V
$340
$347
FY20 FY21 FY22 08/31/22
TTM
Adj. EBITDA less Capital
Expenditures ($M)
$168
$187
FY20 FY21
$289 $300
II
FY22 08/31/22
TTM
Business Segments
8/31/22 TTM Net Sales*
Sustainable
Energy
Solutions
$136
Consumer
Building Products
Products
$577
$677
MAKERS OF BETTER
9View entire presentation