Lyft Results Presentation Deck
Key Highlights Q1'21
Smallest quarterly
Adjusted EBITDA
loss since IPO(¹)
+11%
Outperformance on Q1 Revenue
versus the midpoint of our most
recent outlook
(3)
+51%
Improvement in Q1 Adjusted
EBITDA loss versus Q4
●
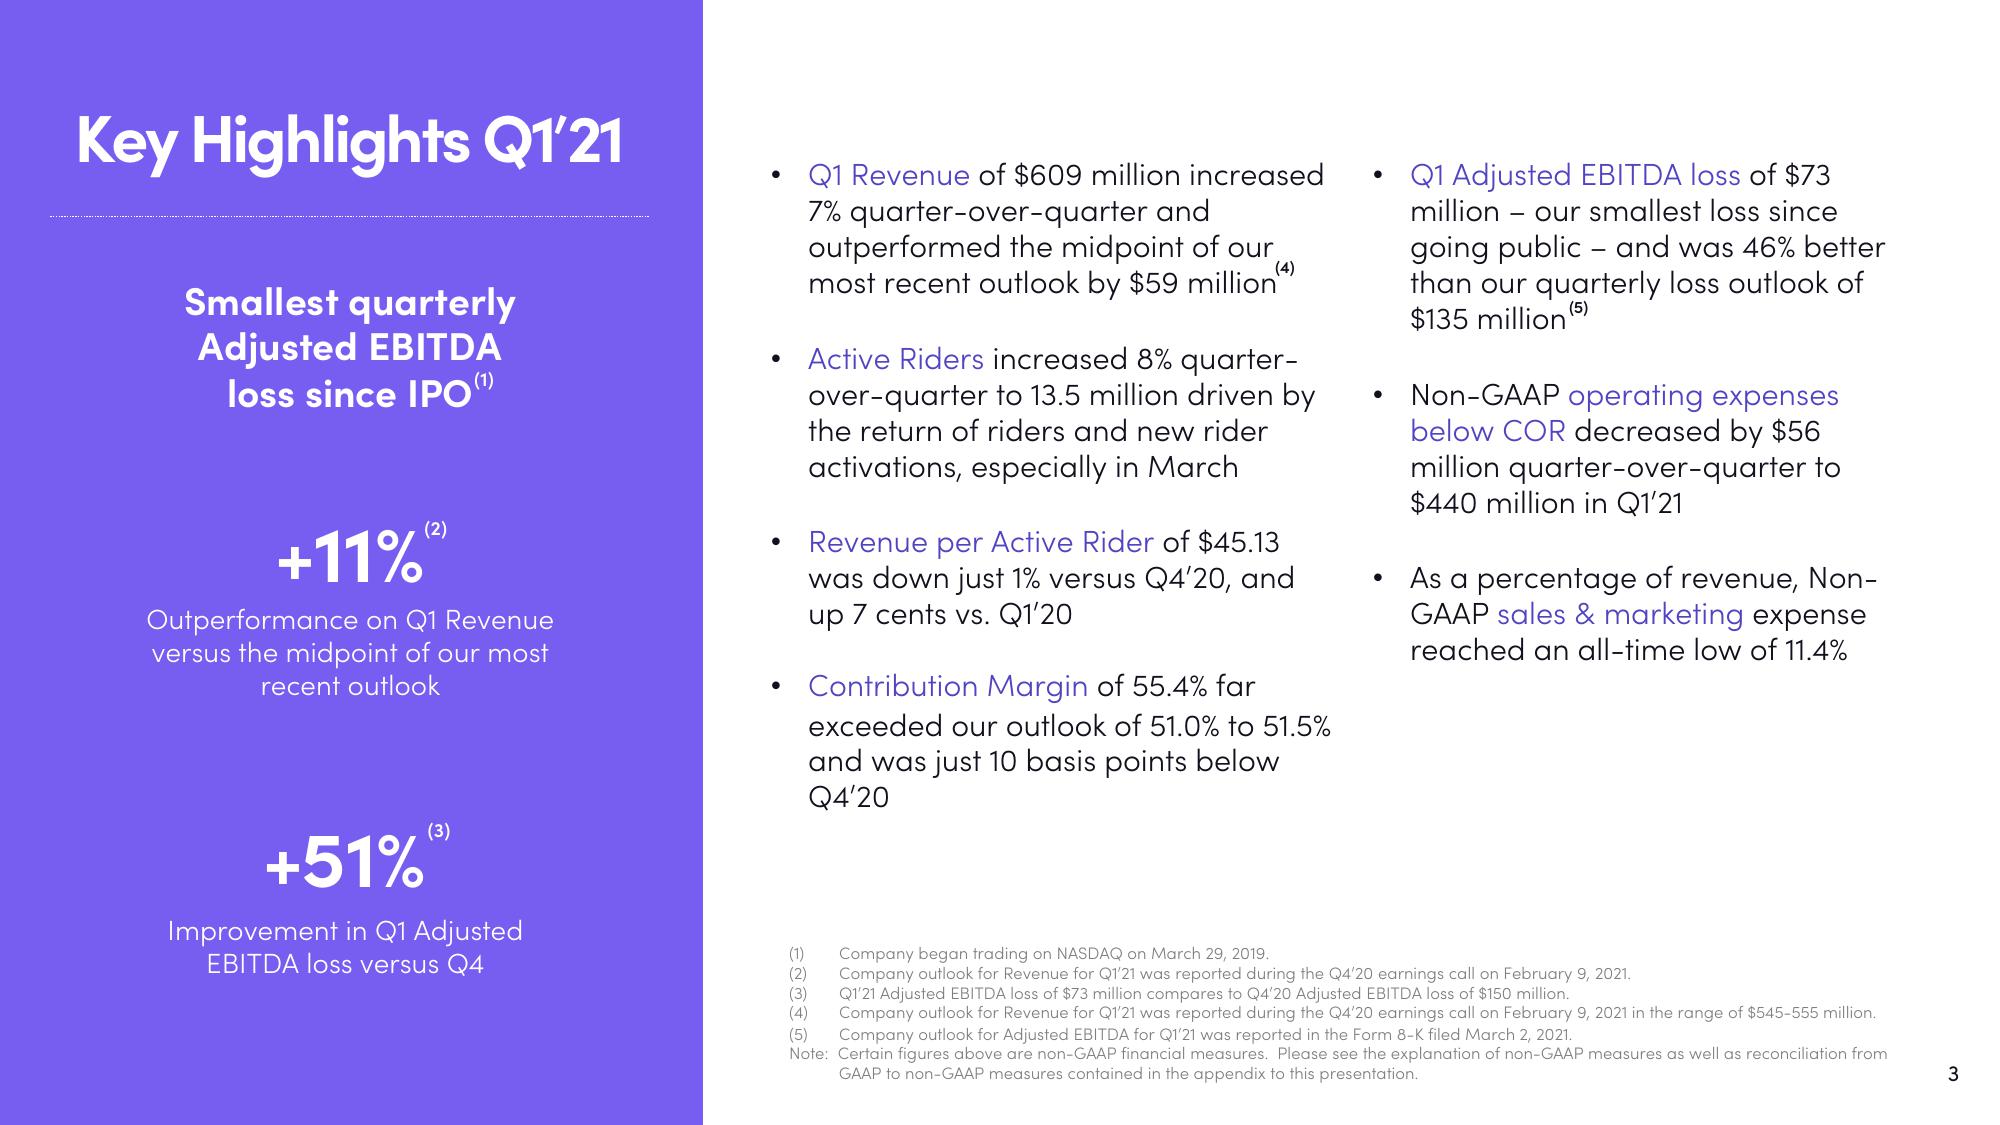
Q1 Revenue of $609 million increased
7% quarter-over-quarter and
outperformed the midpoint of our
most recent outlook by $59 million
(4)
Active Riders increased 8% quarter-
over-quarter to 13.5 million driven by
the return of riders and new rider
activations, especially in March
Revenue per Active Rider of $45.13
was down just 1% versus Q4'20, and
up 7 cents vs. Q1'20
Contribution Margin of 55.4% far
exceeded our outlook of 51.0% to 51.5%
and was just 10 basis points below
Q4'20
(1)
(2)
(3)
(4)
(5)
●
●
●
Q1 Adjusted EBITDA loss of $73
million our smallest loss since
going public and was 46% better
than our quarterly loss outlook of
$135 million 5
(5)
Non-GAAP operating expenses
below COR decreased by $56
million quarter-over-quarter to
$440 million in Q1'21
As a percentage of revenue, Non-
GAAP sales & marketing expense
reached an all-time low of 11.4%
Company began trading on NASDAQ on March 29, 2019.
Company outlook for Revenue for Q1'21 was reported during the Q4'20 earnings call on February 9, 2021.
Q1'21 Adjusted EBITDA loss of $73 million compares to Q4'20 Adjusted EBITDA loss of $150 million.
Company outlook for Revenue for Q1'21 was reported during the Q4'20 earnings call on February 9, 2021 in the range of $545-555 million.
Company outlook for Adjusted EBITDA for Q1'21 was reported in the Form 8-K filed March 2, 2021.
Note: Certain figures above are non-GAAP financial measures. Please see the explanation of non-GAAP measures as well as reconciliation from
GAAP to non-GAAP measures contained in the appendix to this presentation.
3View entire presentation