Oatly Results Presentation Deck
Notes:
1.
2.
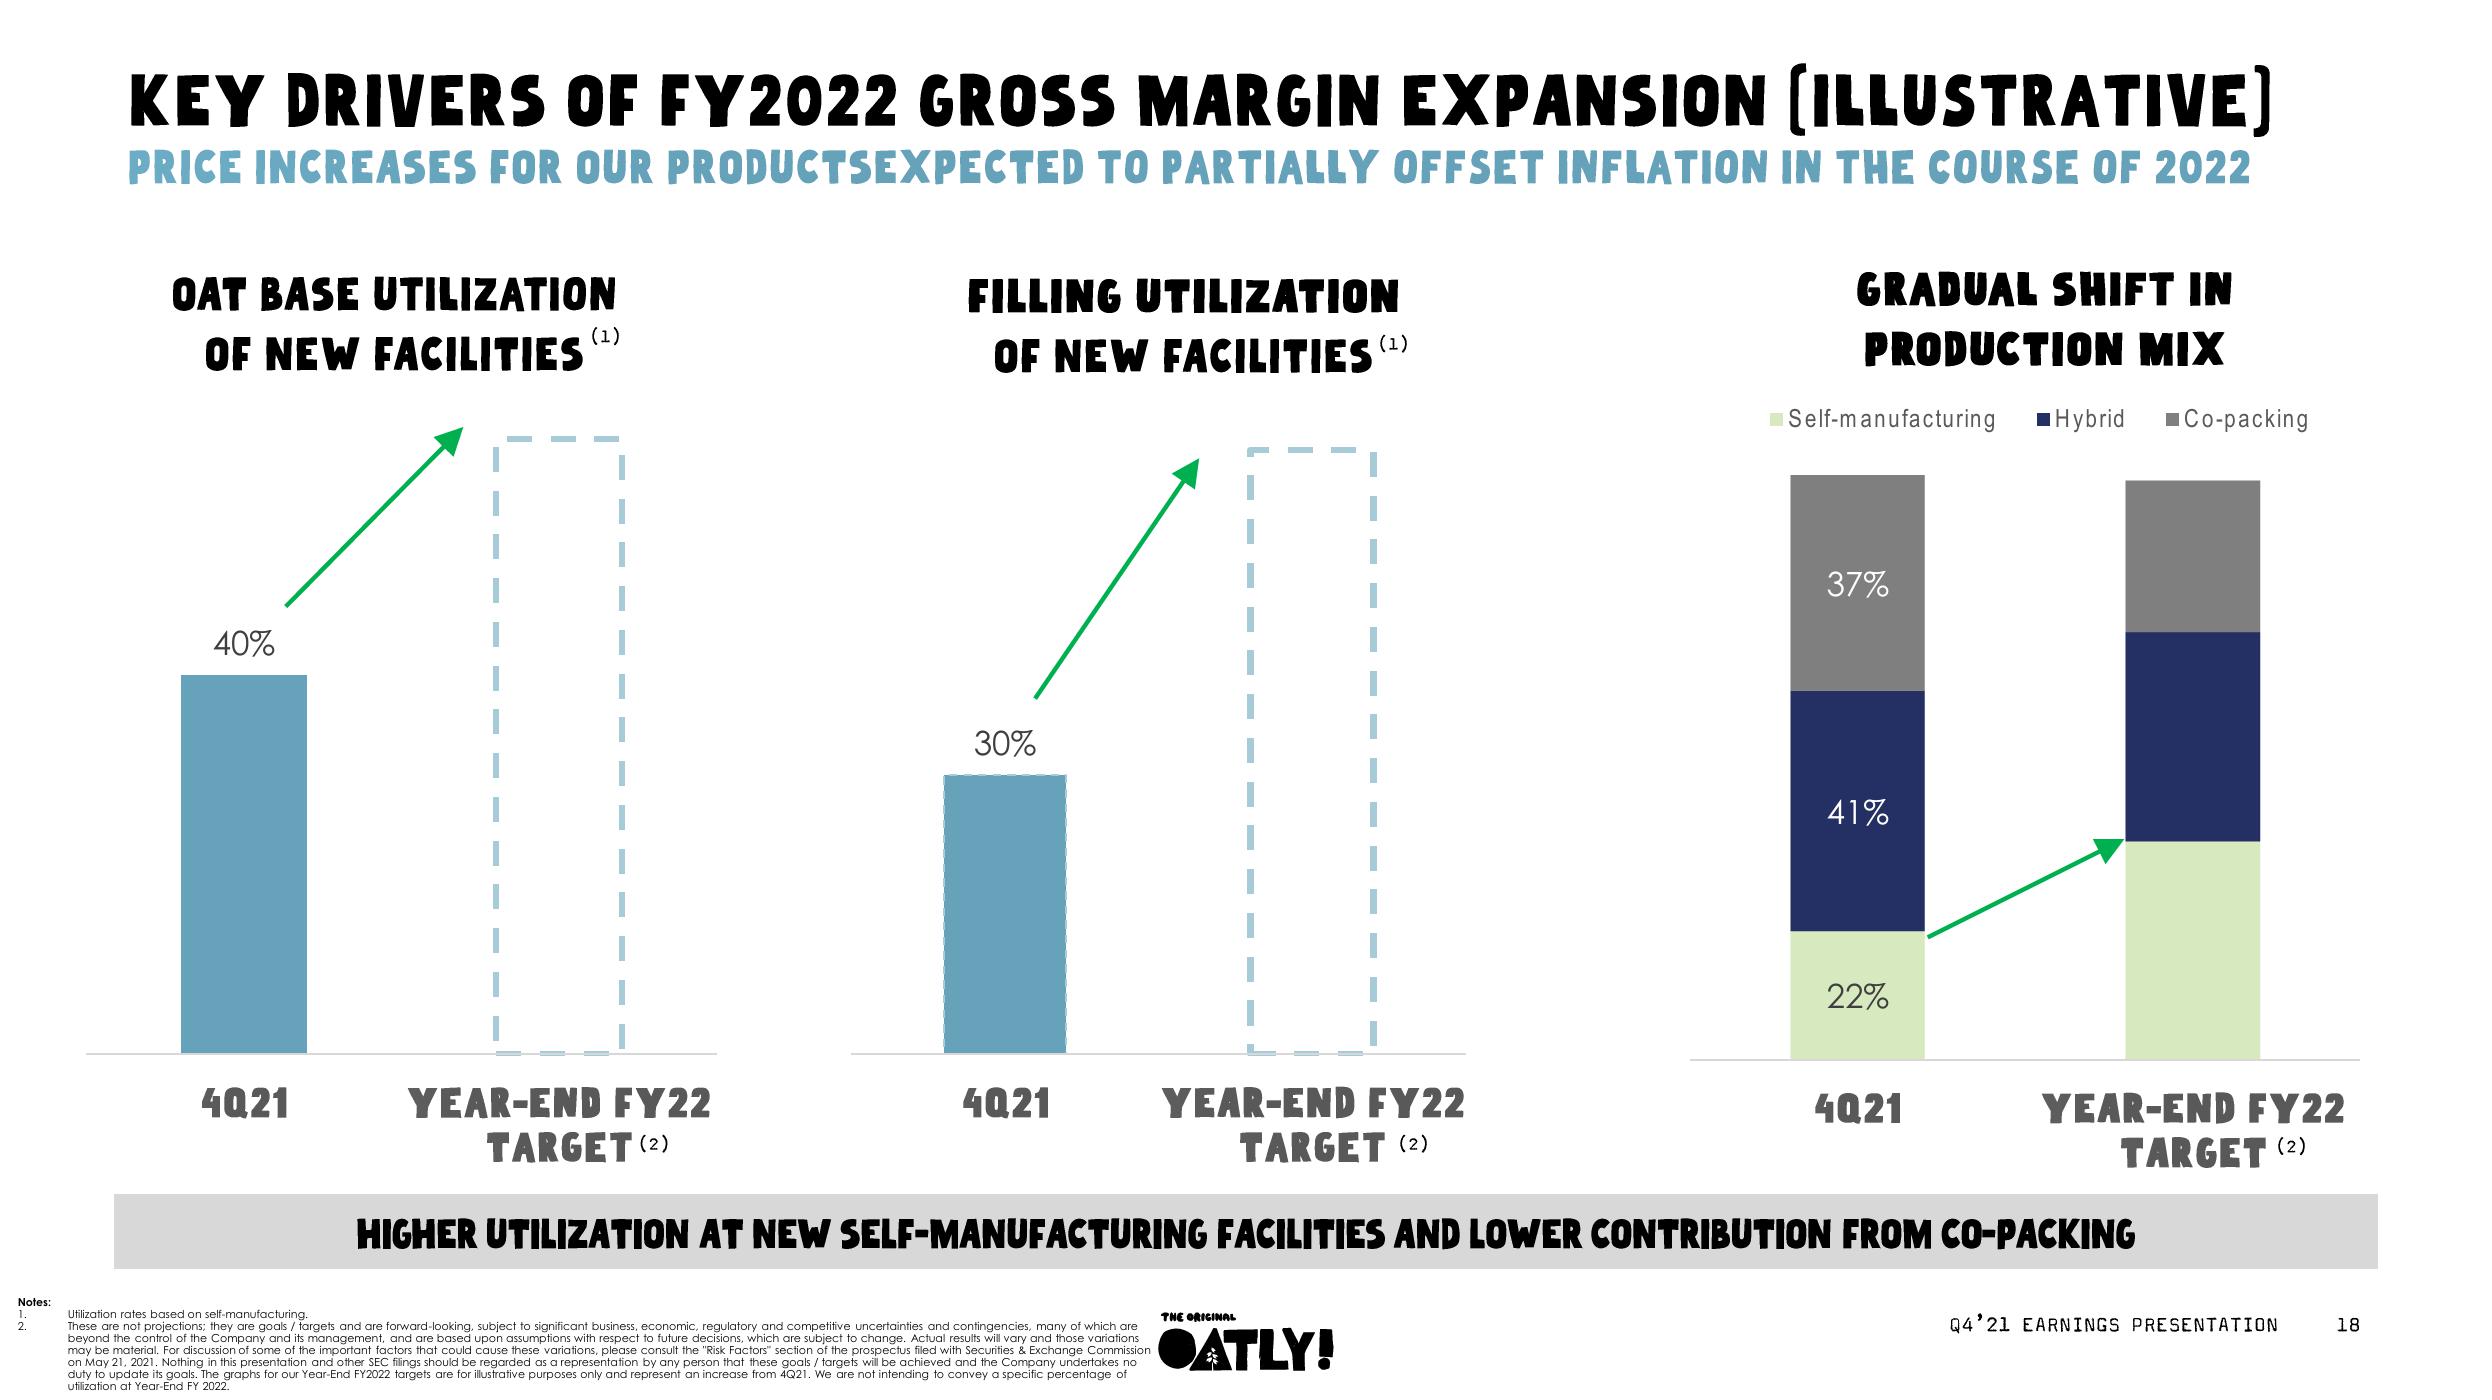
KEY DRIVERS OF FY2022 GROSS MARGIN EXPANSION (ILLUSTRATIVE]
PRICE INCREASES FOR OUR PRODUCTSEXPECTED TO PARTIALLY OFFSET INFLATION IN THE COURSE OF 2022
OAT BASE UTILIZATION
OF NEW FACILITIES
40%
4021
(1)
FILLING UTILIZATION
OF NEW FACILITIES (¹)
30%
4021
Utilization rates based on self-manufacturing.
These are not projections; they are goals / targets and are forward-looking, subject to significant business, economic, regulatory and competitive uncertainties and contingencies, many of which are
beyond the control of the Company and its management, and are based upon assumptions with respect to future decisions, which are subject to change. Actual results will vary and those variations
may be material. For discussion of some of the important factors that could cause these variations, please consult the "Risk Factors" section of the prospectus filed with Securities & Exchange Commission
on May 21, 2021. Nothing in this presentation and other SEC filings should be regarded as a representation by any person that these goals / targets will be achieved and the Company undertakes no
duty to update its goals. The graphs for our Year-End FY2022 targets are for illustrative purposes only and represent an increase from 4Q21. We are not intending to convey a specific percentage of
utilization at Year-End FY 2022.
THE ORIGINAL
GRADUAL SHIFT IN
PRODUCTION MIX
OATLY!
Self-manufacturing ■Hybrid Co-packing
YEAR-END FY22
TARGET (2)
YEAR-END FY22
TARGET (2)
HIGHER UTILIZATION AT NEW SELF-MANUFACTURING FACILITIES AND LOWER CONTRIBUTION FROM CO-PACKING
37%
41%
22%
4021
YEAR-END FY22
TARGET (2)
Q4'21 EARNINGS PRESENTATION
18View entire presentation