Blackwells Capital Activist Presentation Deck
BUSINESS OVERVIEW - FINANCIALS
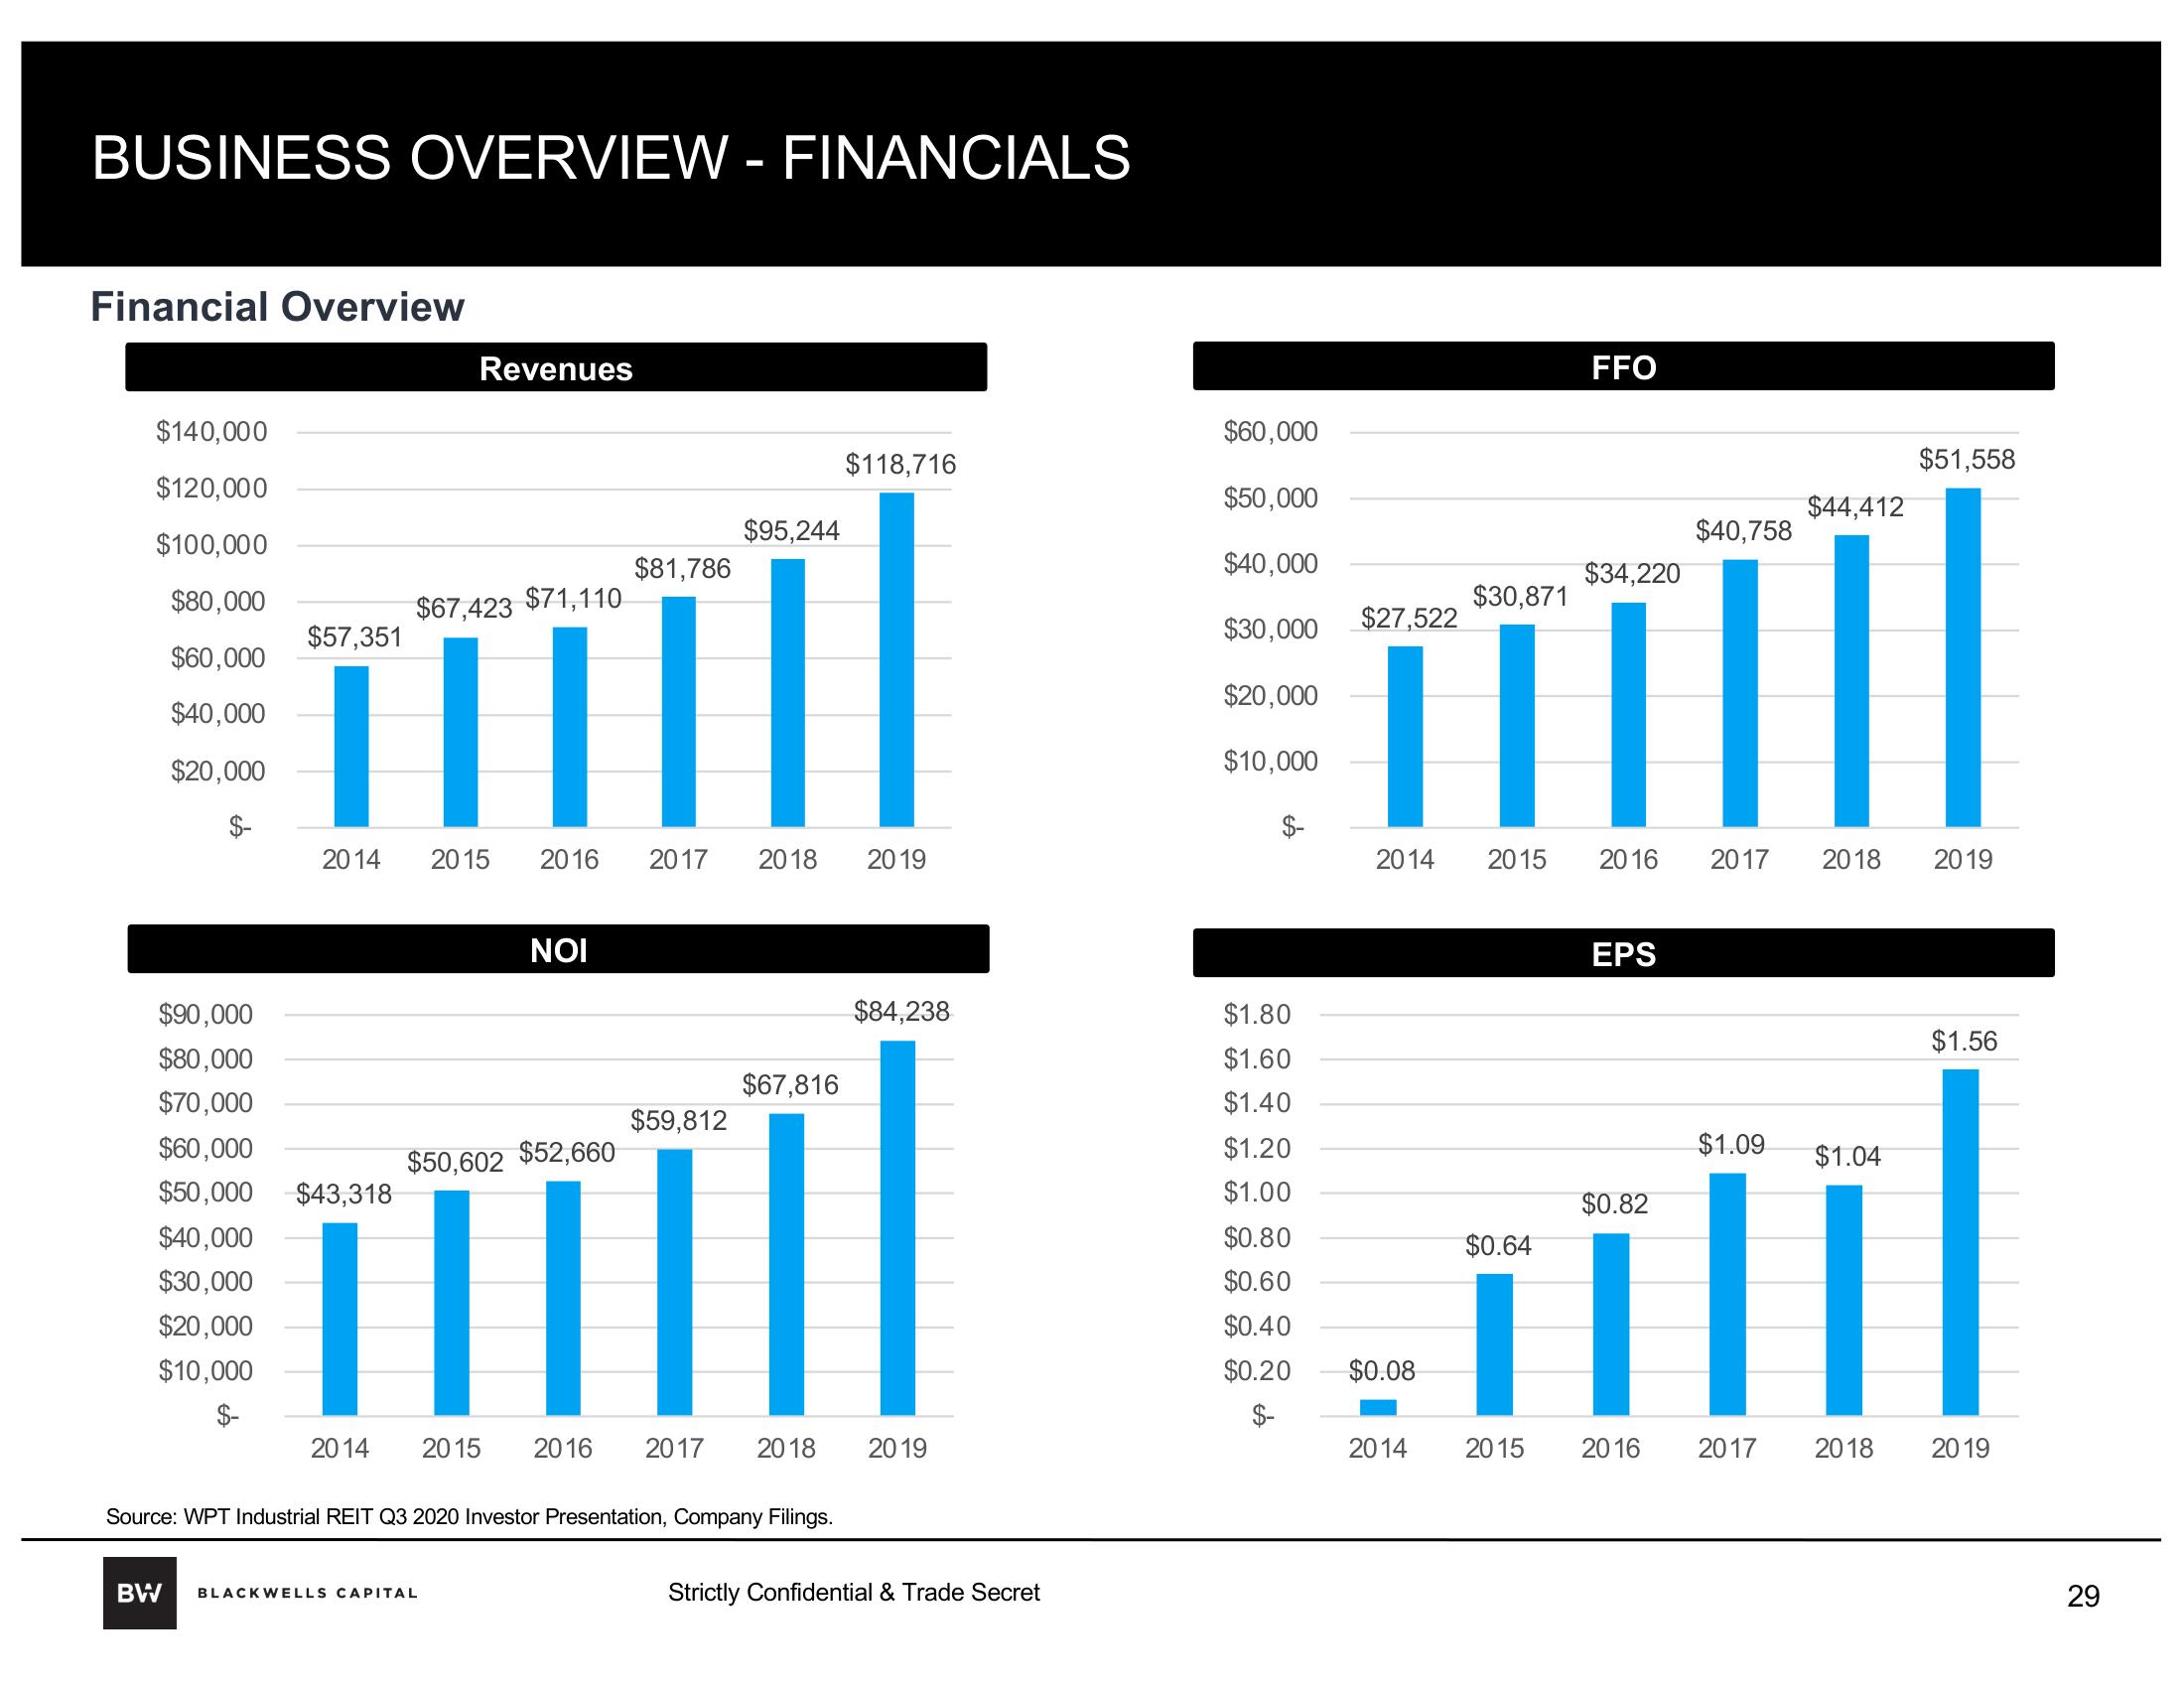
Financial Overview
$140,000
$120,000
$100,000
$80,000
$60,000
$40,000
$20,000
$57,351
2014
$67,423 $71,110
[[|||
$90,000
$80,000
$70,000
$60,000
$50,000 $43,318
$40,000
$30,000
$20,000
$10,000
Revenues
$81,786
NOI
$50,602 $52,660
BW BLACKWELLS CAPITAL
$95,244
2015 2016 2017 2018 2019
$59,812
$67,816
$118,716
Source: WPT Industrial REIT Q3 2020 Investor Presentation, Company Filings.
2014 2015 2016 2017 2018 2019
$84,238
Strictly Confidential & Trade Secret
$60,000
$50,000
$40,000
$30,000
$20,000
$10,000
$1.80
$1.60
$1.40
$1.20
$1.00
$0.80
$0.60
$0.40
$0.20
$-
$27,522
$0.08
$30,871
2014
2014 2015 2016 2017
$0.64
FFO
2015
$34,220
EPS
$0.82
$40,758
2016
$1.09
$44,412
2017
$1.04
||
$51,558
2018 2019
$1.56
2018 2019
29View entire presentation