Forge SPAC Presentation Deck
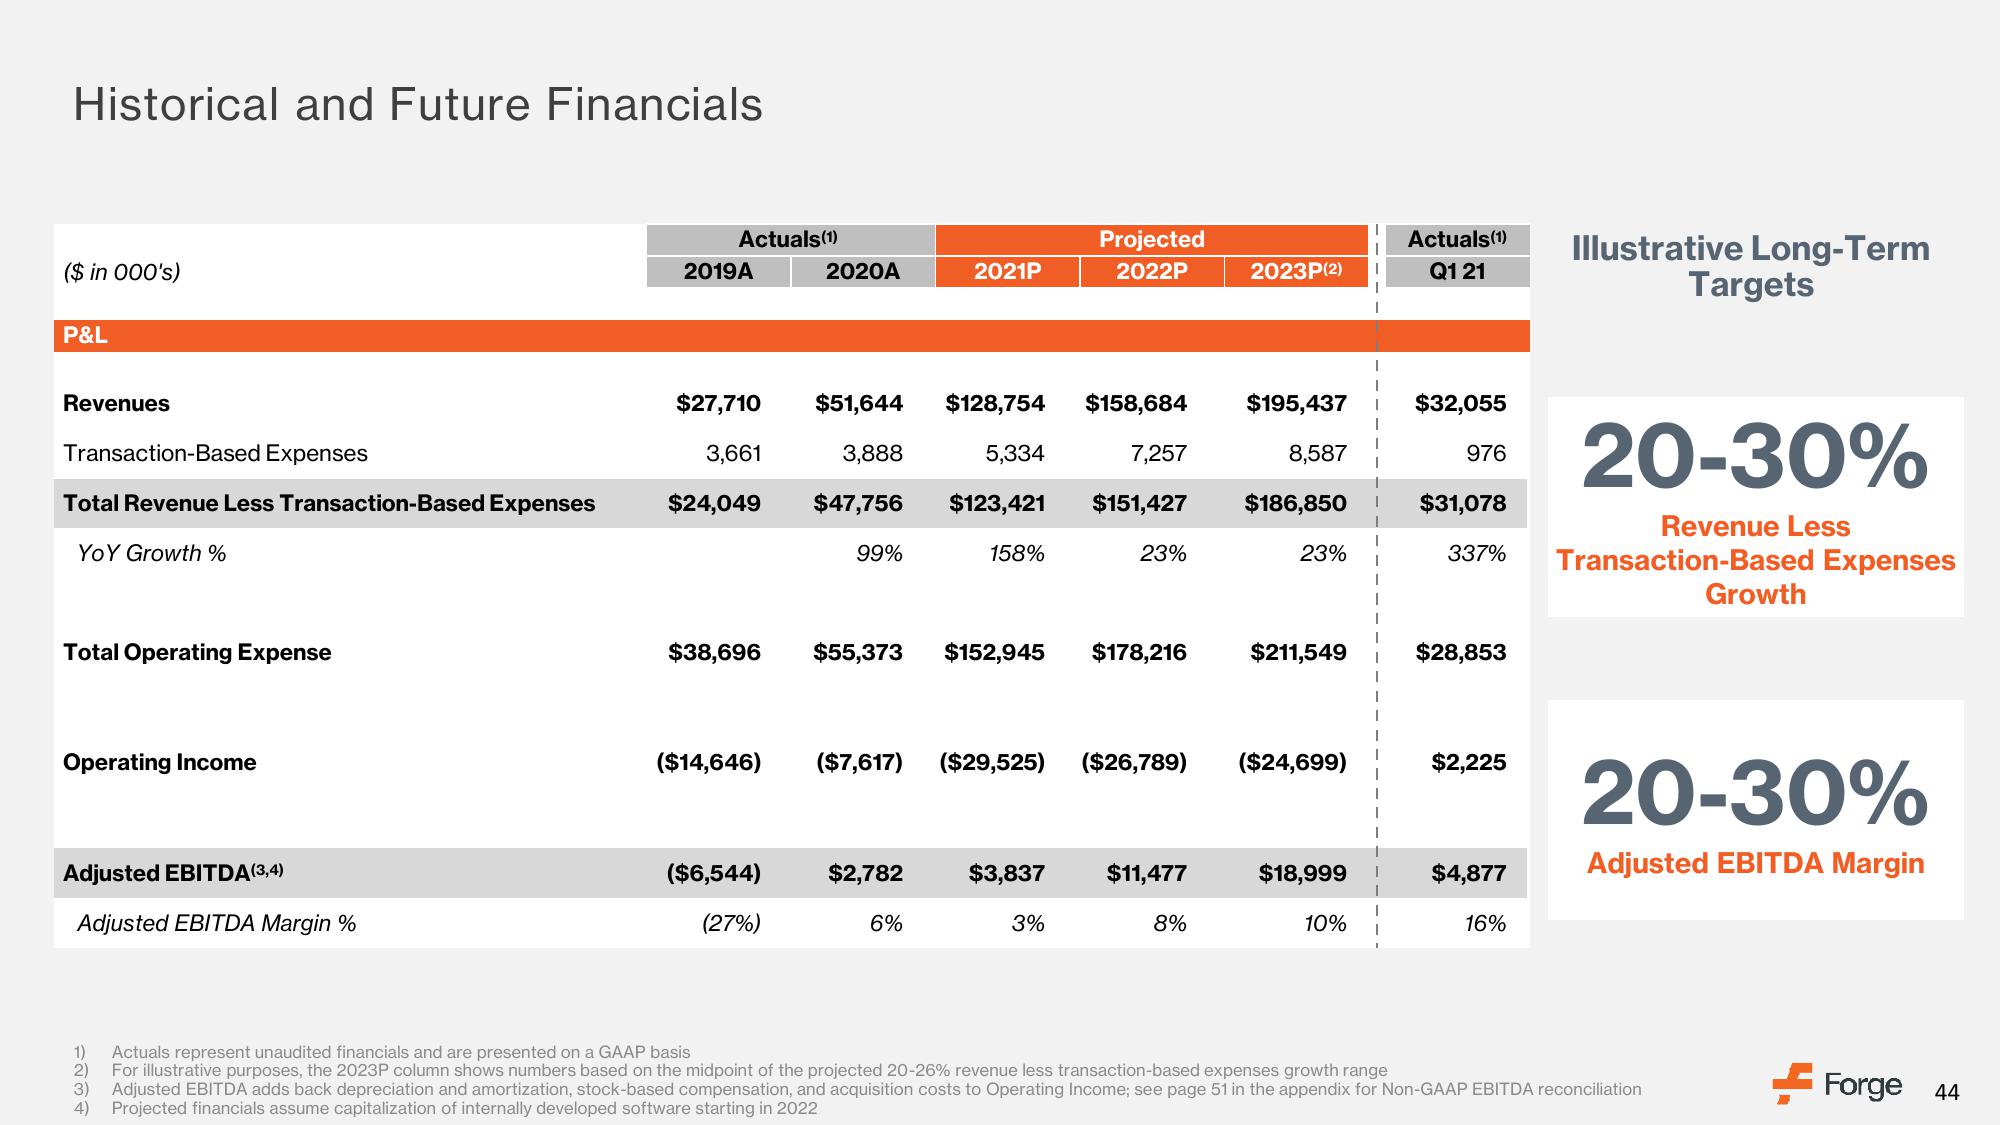
Historical and Future Financials
($ in 000's)
P&L
Revenues
Transaction-Based Expenses
Total Revenue Less Transaction-Based Expenses
YOY Growth %
Total Operating Expense
Operating Income
EBITDA (3,4)
Adjusted EBITDA Margin %
Actuals (1)
2019A
$27,710
3,661
$24,049
($14,646)
2020A
($6,544)
(27%)
$51,644
3,888
$47,756
99%
2021P
$2,782
$38,696 $55,373 $152,945 $178,216
6%
$128,754 $158,684
5,334
7,257
$123,421 $151,427
158%
Projected
2022P
23%
3%
($7,617) ($29,525) ($26,789) ($24,699)
$11,477
2023P(2)
8%
$195,437
8,587
$186,850
23%
$211,549
$18,999
10%
I
Actuals (1)
Q1 21
$32,055
976
$31,078
337%
$28,853
$2,225
$4,877
16%
Illustrative Long-Term
Targets
20-30%
Revenue Less
Transaction-Based Expenses
1)
Actuals represent unaudited financials and are presented on a GAAP basis
2)
For illustrative purposes, the 2023P column shows numbers based on the midpoint of the projected 20-26% revenue less transaction-based expenses growth range
3) Adjusted EBITDA adds back depreciation and amortization, stock-based compensation, and acquisition costs to Operating Income; see page 51 in the appendix for Non-GAAP EBITDA reconciliation
4) Projected financials assume capitalization of internally developed software starting in 2022
Growth
20-30%
Adjusted EBITDA Margin
Forge 44View entire presentation