Fastly Investor Day Presentation Deck
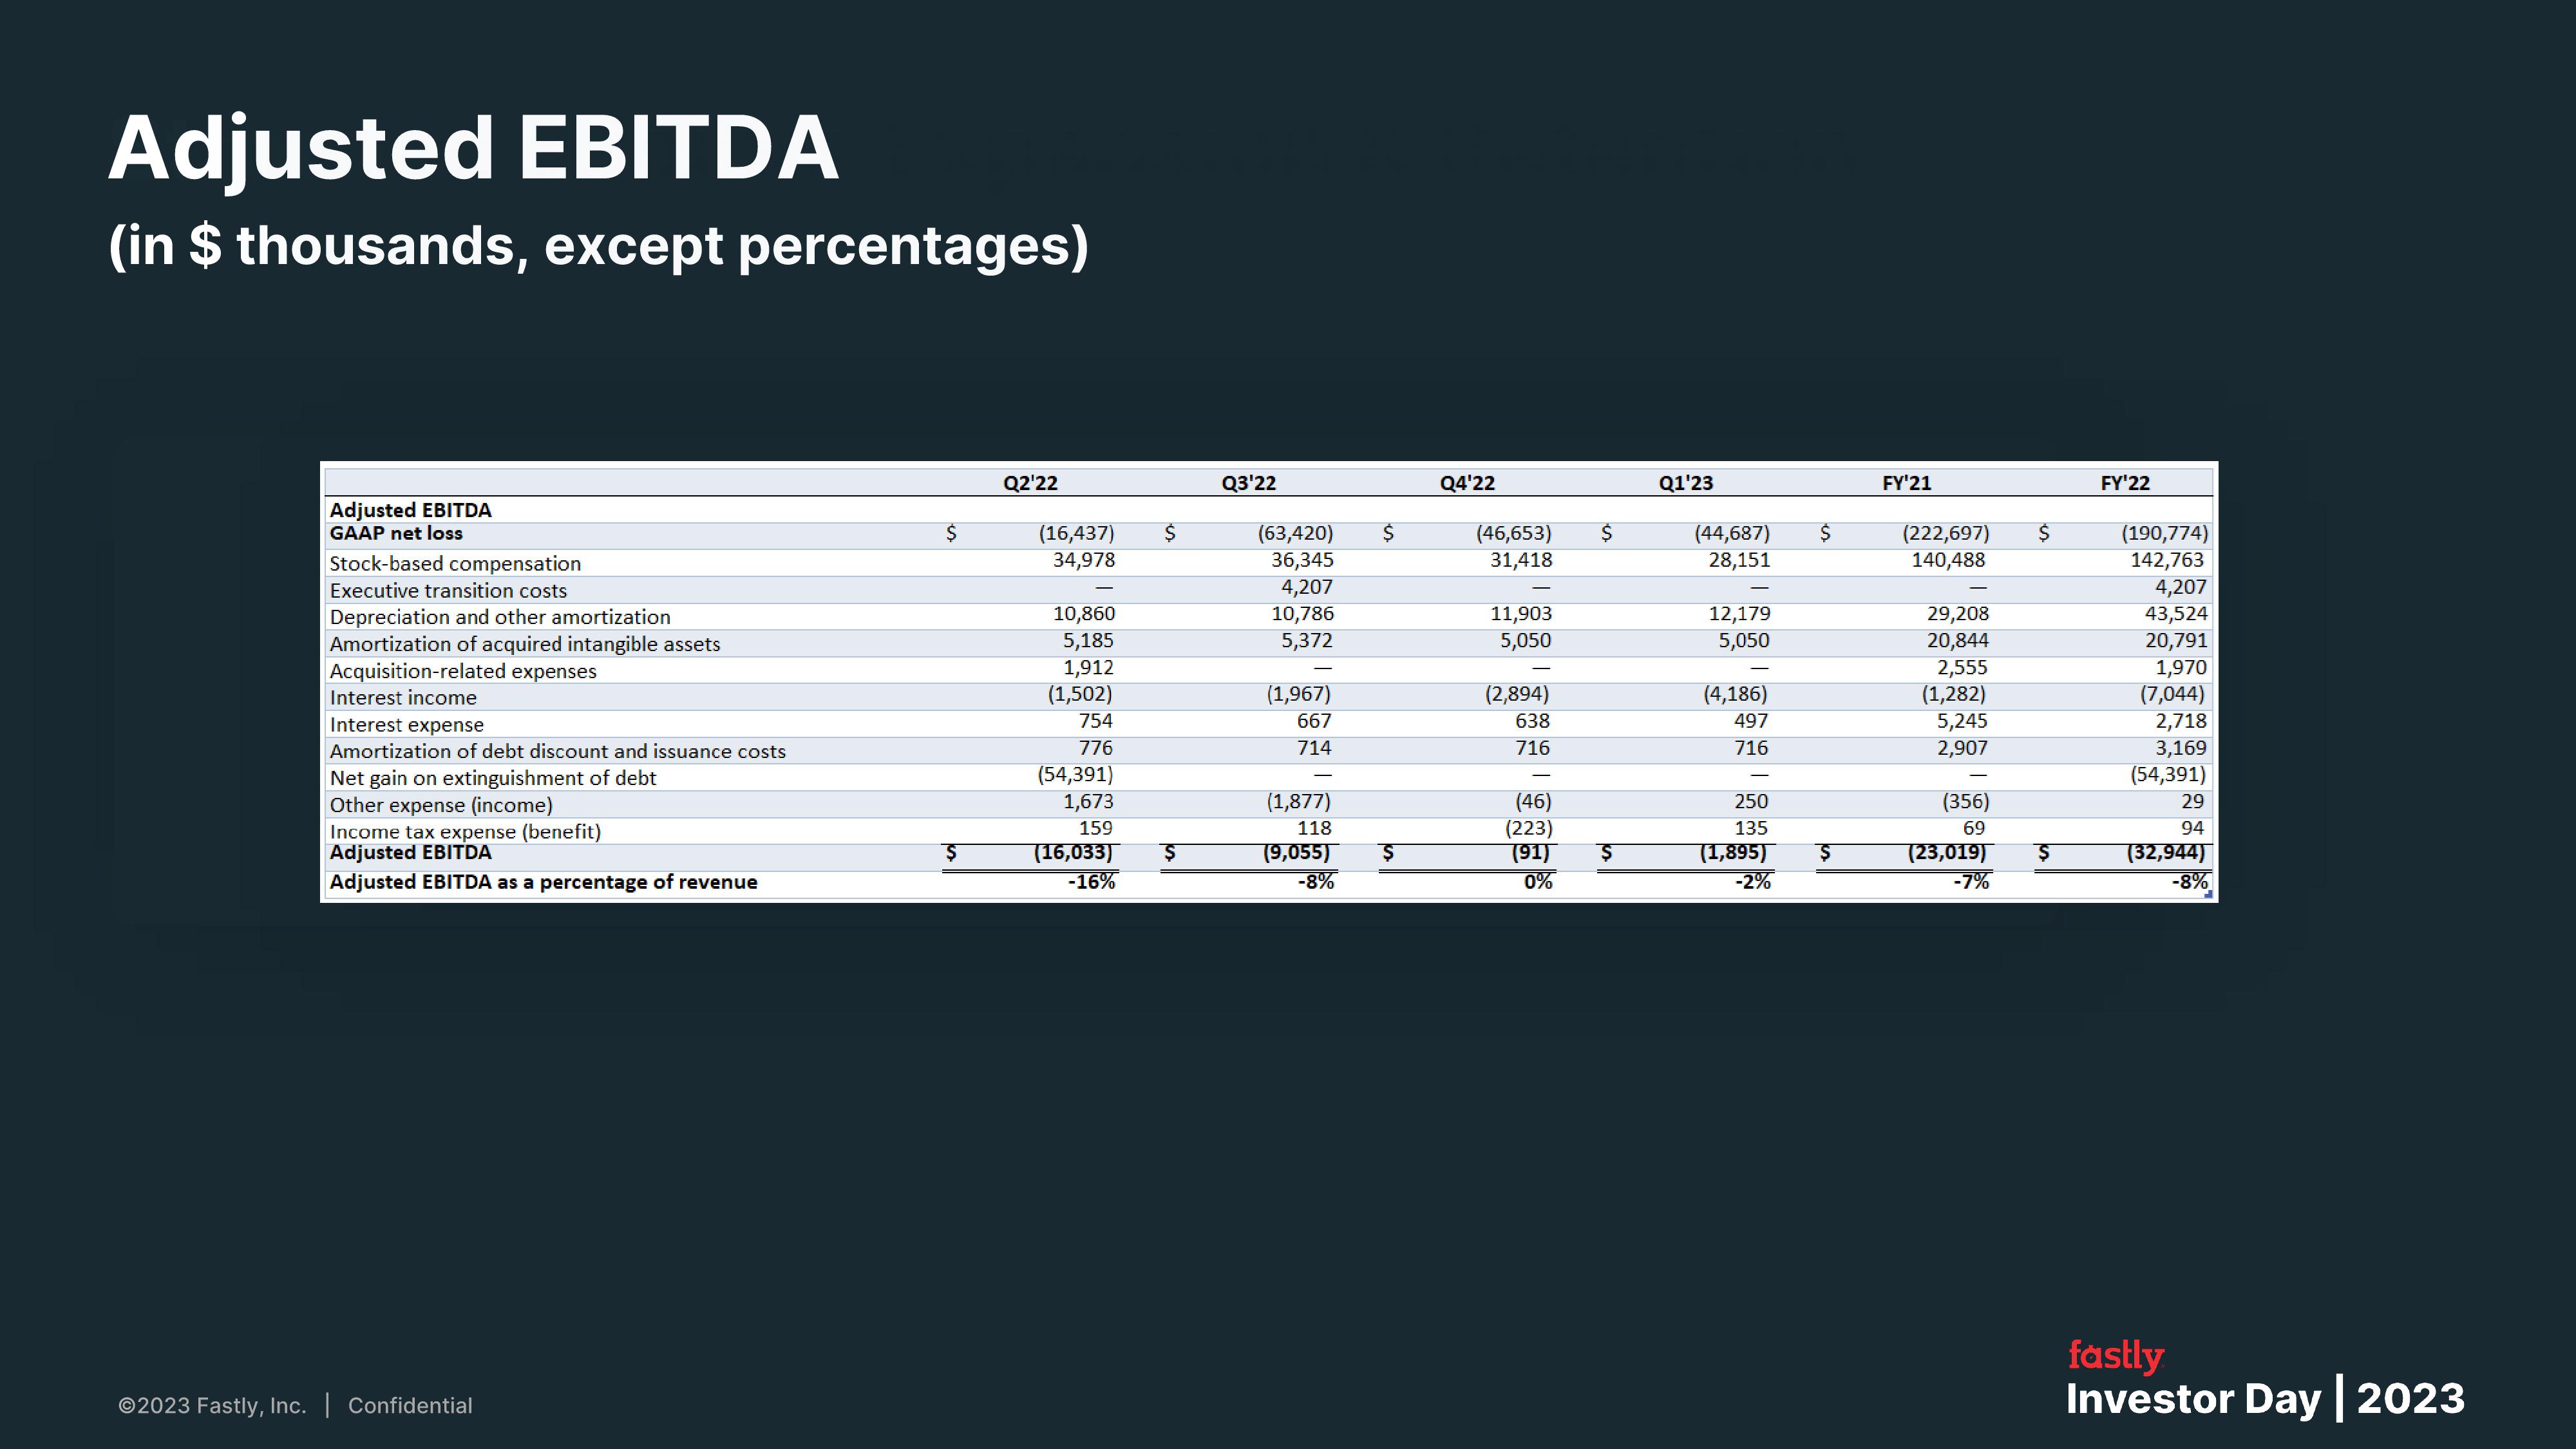
Adjusted EBITDA
(in $ thousands, except percentages)
Adjusted EBITDA
GAAP net loss
Stock-based compensation
Executive transition costs
Depreciation and other amortization
Amortization of acquired intangible assets
Acquisition-related expenses
Interest income
Interest expense
Amortization of debt discount and issuance costs
Net gain on extinguishment of debt
Other expense (income)
Income tax expense (benefit)
Adjusted EBITDA
Adjusted EBITDA as a percentage of revenue
Ⓒ2023 Fastly, Inc. | Confidential
$
$
Q2'22
(16,437)
34,978
10,860
5,185
1,912
(1,502)
754
776
(54,391)
1,673
159
(16,033)
-16%
$
$
Q3'22
(63,420)
36,345
4,207
10,786
5,372
(1,967)
667
714
(1,877)
118
(9,055)
-8%
$
$
Q4'22
(46,653)
31,418
11,903
5,050
(2,894)
638
716
(46)
(223)
(91)
0%
$
$
Q1'23
(44,687)
28,151
12,179
5,050
(4,186)
497
716
250
135
(1,895)
-2%
$
$
FY'21
(222,697)
140,488
29,208
20,844
2,555
(1,282)
5,245
2,907
(356)
69
(23,019)
-7%
$
$
FY'22
(190,774)
142,763
4,207
43,524
20,791
1,970
(7,044)
2,718
3,169
(54,391)
29
94
(32,944)
-8%
fastly
Investor Day | 2023View entire presentation