First Merchants Investor Presentation Deck
Business Highlights
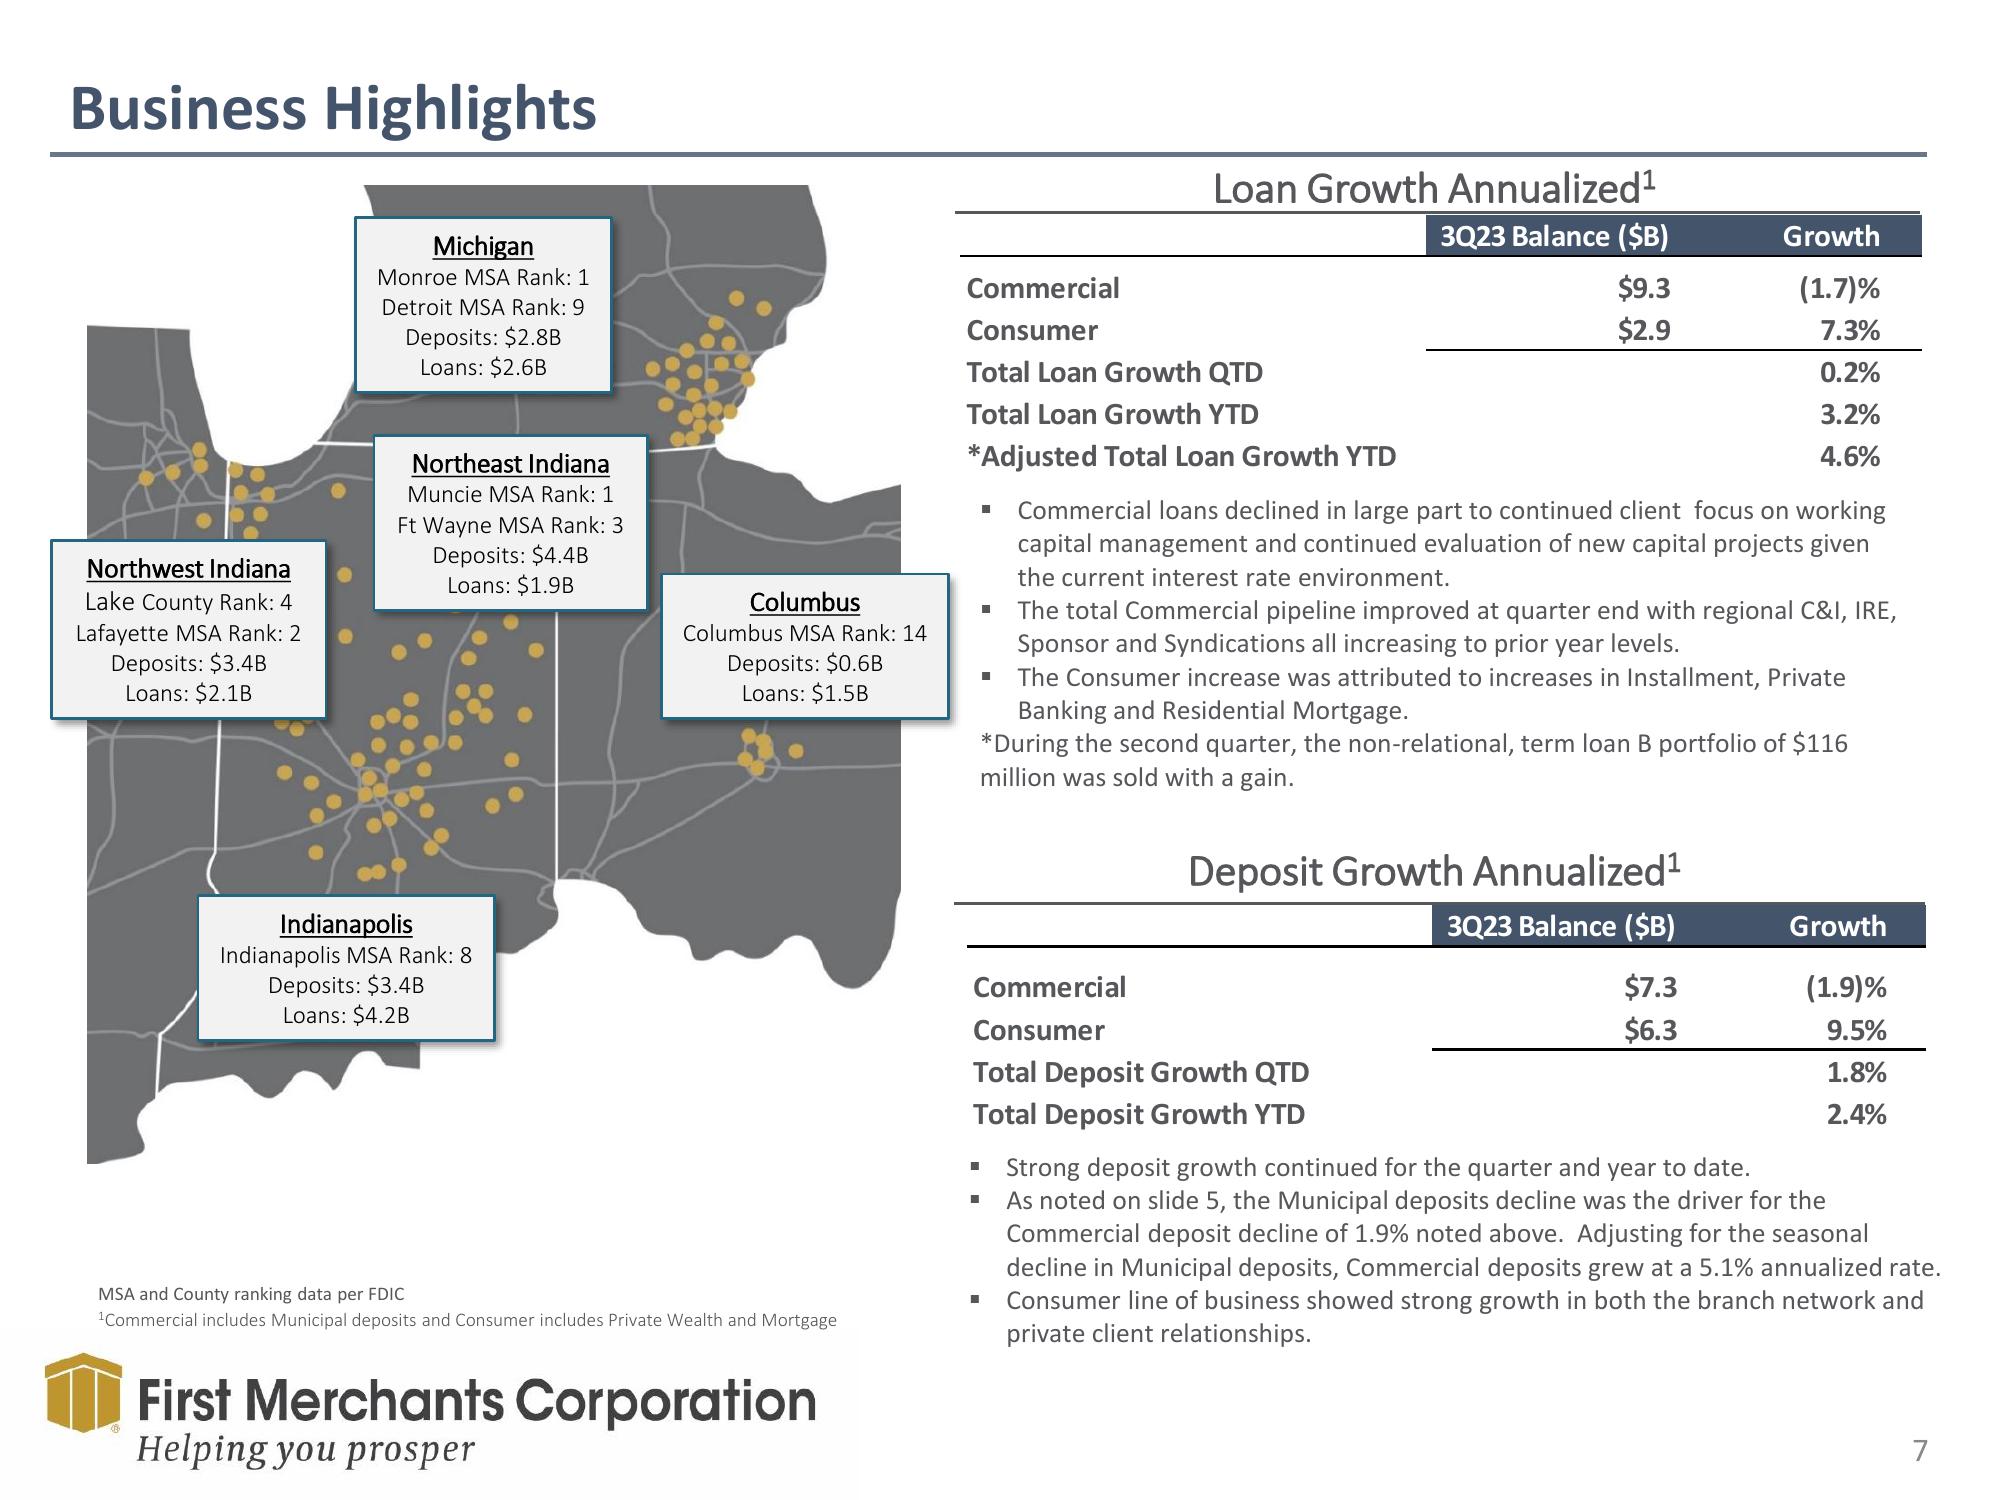
Northwest Indiana
Lake County Rank: 4
Lafayette MSA Rank: 2
Deposits: $3.4B
Loans: $2.1B
Michigan
Monroe MSA Rank: 1.
Detroit MSA Rank: 9
Deposits: $2.8B
Loans: $2.6B
Northeast Indiana
Muncie MSA Rank: 1
Ft Wayne MSA Rank: 3
Deposits: $4.4B
Loans: $1.9B
Indianapolis
Indianapolis MSA Rank: 8
Deposits: $3.4B
Loans: $4.2B
Columbus
Columbus MSA Rank: 14
Deposits: $0.6B
Loans: $1.5B
MSA and County ranking data per FDIC
¹Commercial includes Municipal deposits and Consumer includes Private Wealth and Mortgage
First Merchants Corporation
Helping you prosper
Commercial
Consumer
Total Loan Growth QTD
Total Loan Growth YTD
*Adjusted Total Loan Growth YTD
■
Loan Growth Annualized¹
3Q23 Balance ($B)
Commercial
Consumer
$9.3
$2.9
Commercial loans declined in large part to continued client focus on working
capital management and continued evaluation of new capital projects given
the current interest rate environment.
■
The total Commercial pipeline improved at quarter end with regional C&I, IRE,
Sponsor and Syndications all increasing to prior year levels.
The Consumer increase was attributed to increases in Installment, Private
Banking and Residential Mortgage.
*During the second quarter, the non-relational, term loan B portfolio of $116
million was sold with a gain.
Total Deposit Growth QTD
Total Deposit Growth YTD
Growth
(1.7)%
7.3%
0.2%
3.2%
4.6%
Deposit Growth Annualized¹
3Q23 Balance ($B)
$7.3
$6.3
Growth
(1.9)%
9.5%
1.8%
2.4%
▪ Strong deposit growth continued for the quarter and year to date.
■
As noted on slide 5, the Municipal deposits decline was the driver for the
Commercial deposit decline of 1.9% noted above. Adjusting for the seasonal
decline in Municipal deposits, Commercial deposits grew at a 5.1% annualized rate.
Consumer line of business showed strong growth in both the branch network and
private client relationships.
7View entire presentation