Lanvin Results Presentation Deck
NON-IFRS FINANCIAL MEASURES
(€ in Thousands, unless otherwise noted)
Reconciliation of Adjusted EBITDA
Loss for the year
Add / (Deduct) the impact of:
Income tax benefits/(expenses)
Finance cost-net
Non-underlying items (1)
Loss from operations before non-underlying items
Add/ (Deduct) the impact of:
Share based compensation
Provisions and impairment losses
Net foreign exchange (gains) / losses
Depreciation / Amortization
Adjusted EBITDA
2020A
FY
-135,657
-1,603
12,989
-43,546
-167,817
5,389
22,676
3,304
48,332
-88,116
2021 A
FY
-76,452
4,331
9,313
-45,206
-108,014
7,208
10,766
-10,489
41,584
-58,945
2022A
FY
-239,751
-129
14,556
83,057
-142,267
7,431
16,729
339
45,810
-71,958
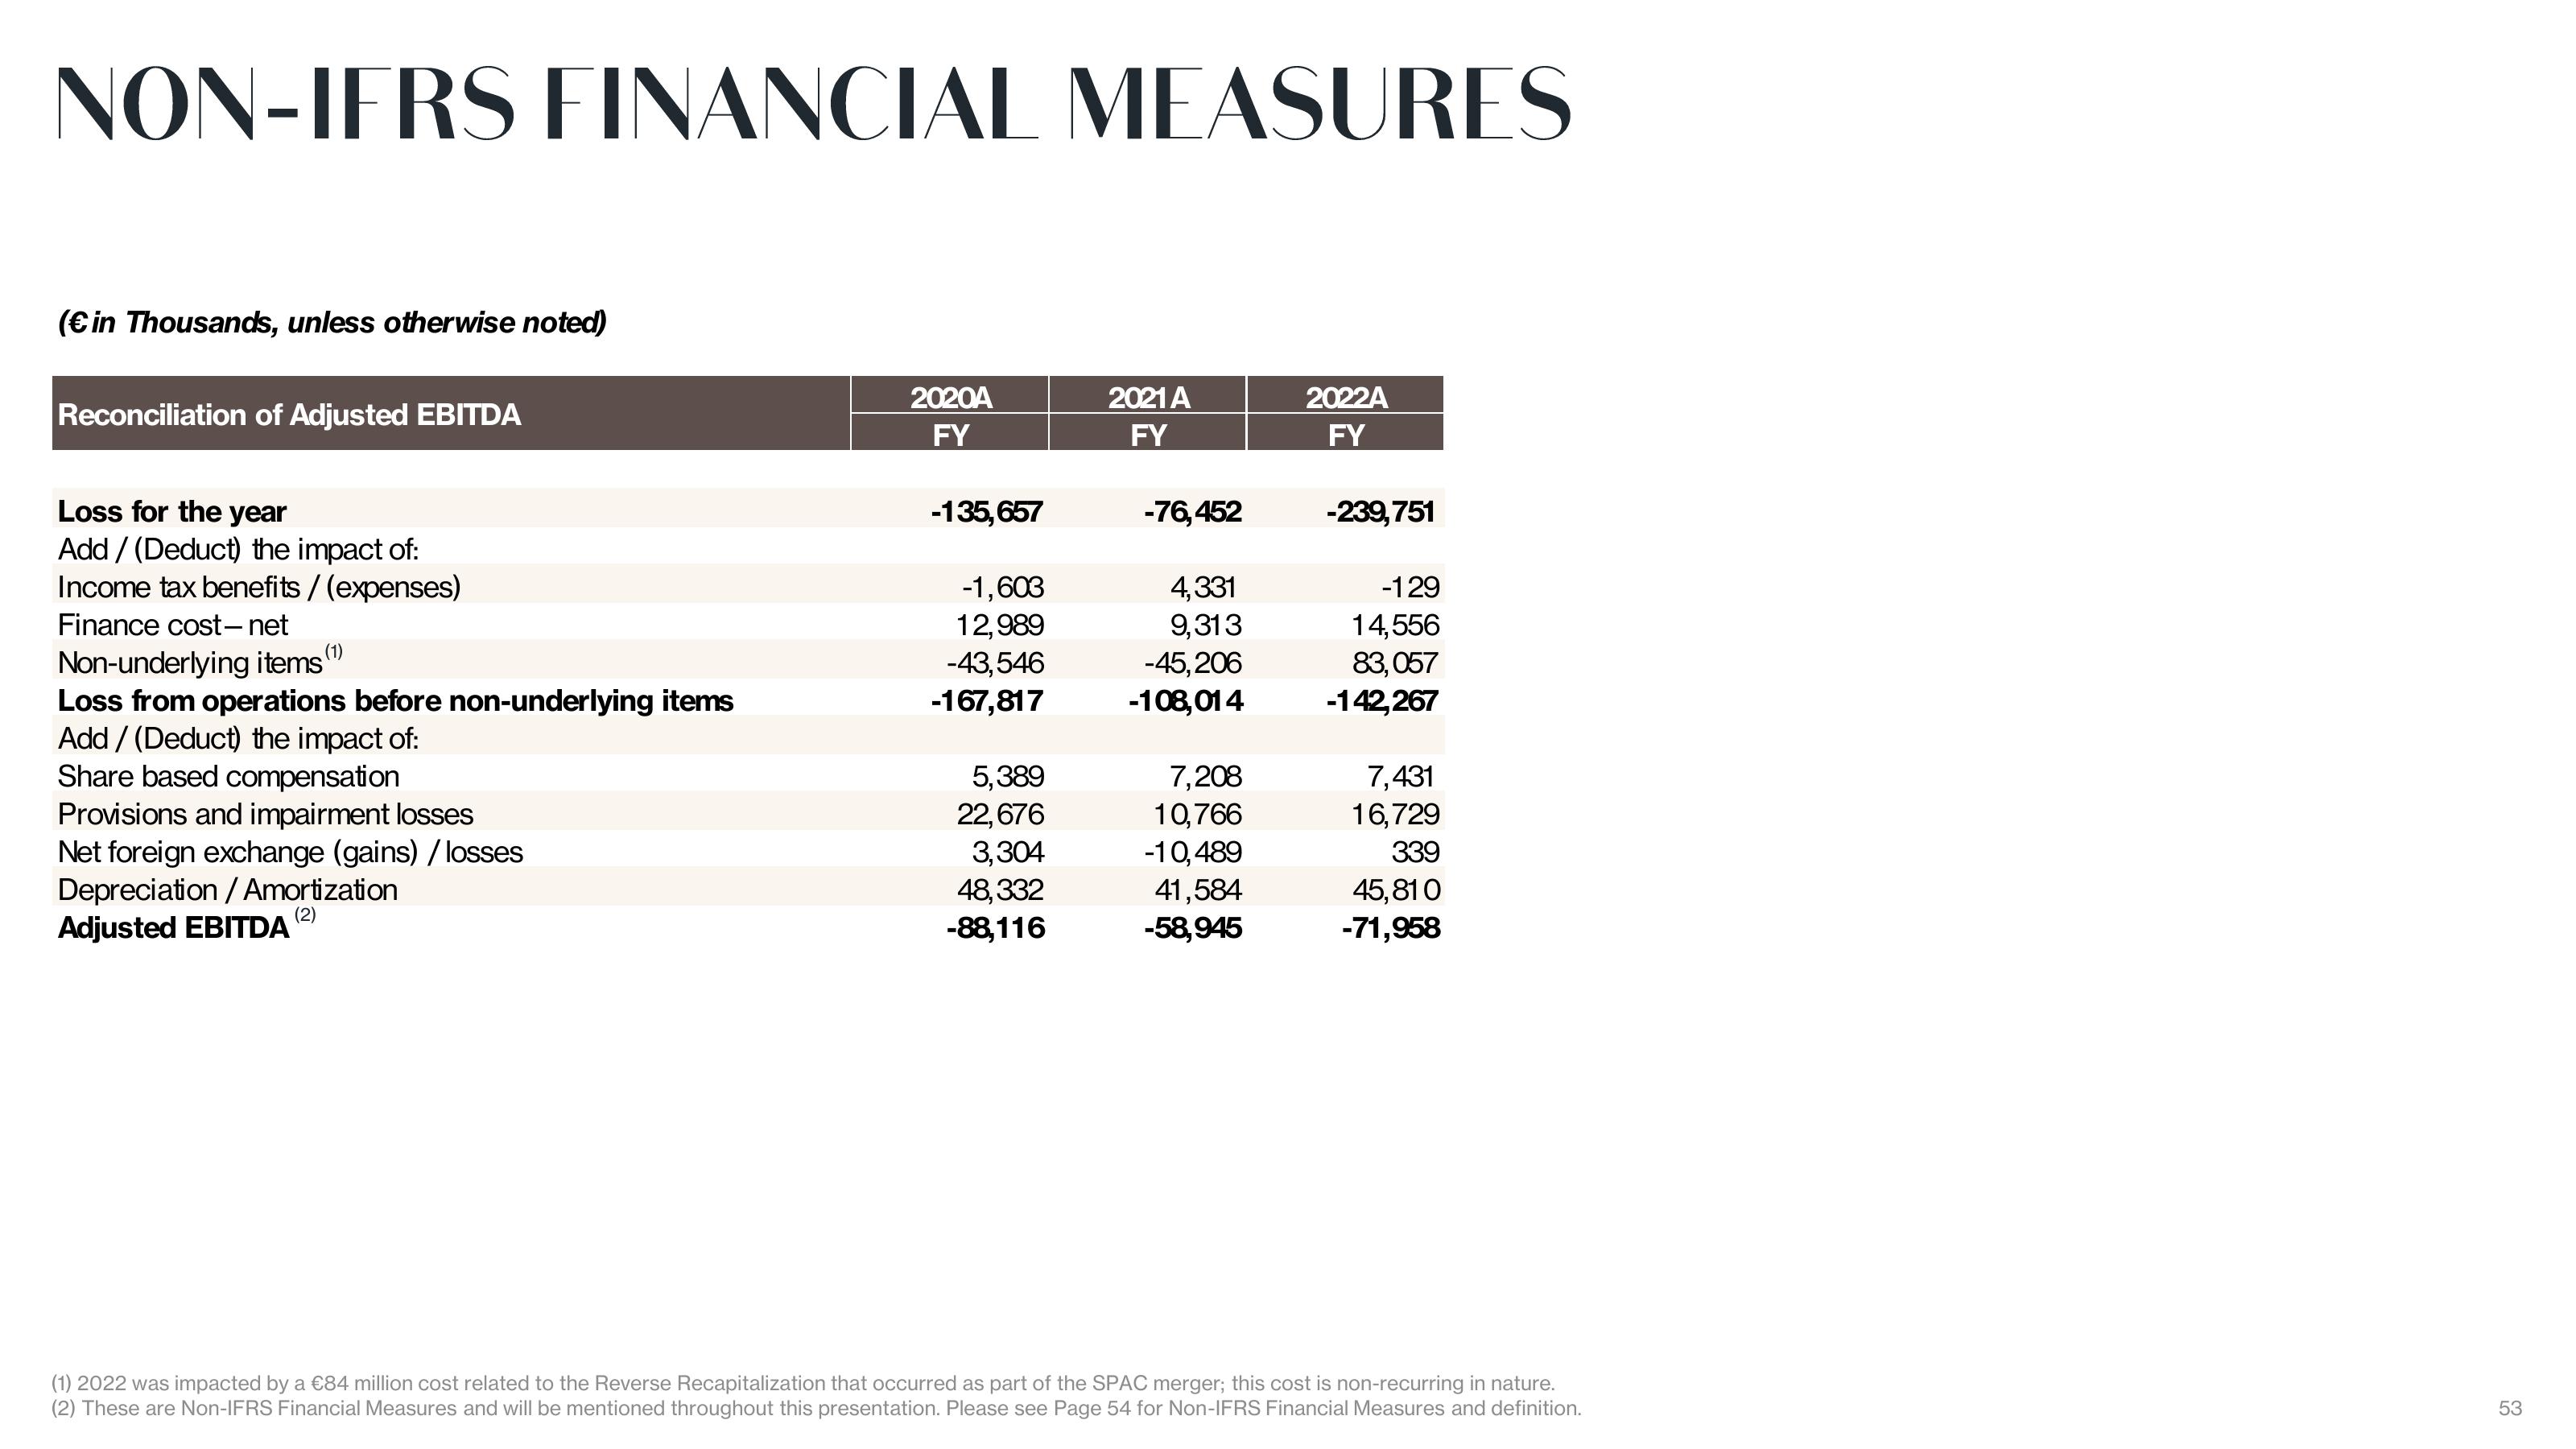
(1) 2022 was impacted by a €84 million cost related to the Reverse Recapitalization that occurred as part of the SPAC merger; this cost is non-recurring in nature.
(2) These are Non-IFRS Financial Measures and will be mentioned throughout this presentation. Please see Page 54 for Non-IFRS Financial Measures and definition.
53View entire presentation