dLocal Results Presentation Deck
TPV
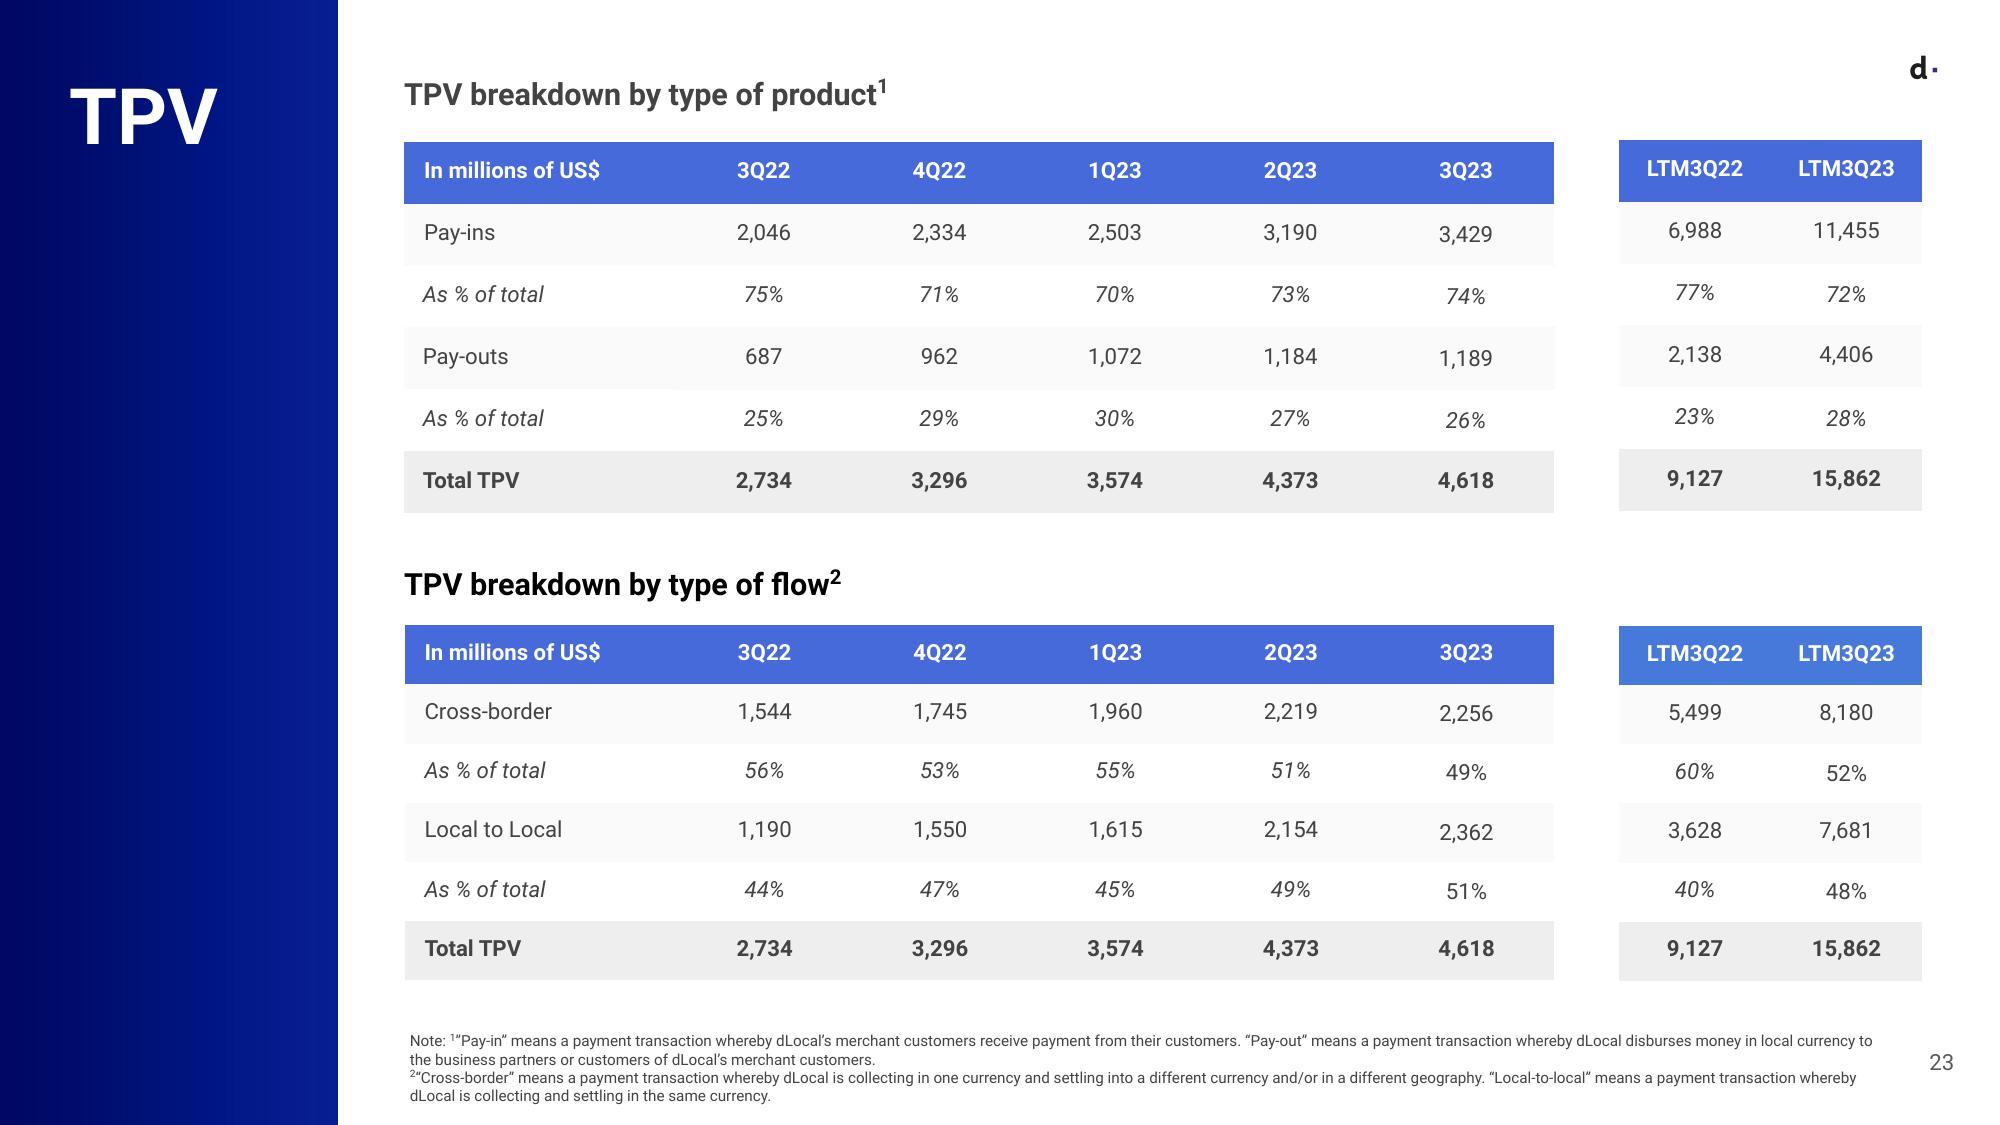
TPV breakdown by type of product¹
In millions of US$
Pay-ins
As % of total
Pay-outs
As % of total
Total TPV
In millions of US$
Cross-border
As % of total
Local to Local
As % of total
3Q22
TPV breakdown by type of flow²
Total TPV
2,046
75%
687
25%
2,734
3Q22
1,544
56%
1,190
44%
2,734
4Q22
2,334
71%
962
29%
3,296
4Q22
1,745
53%
1,550
47%
3,296
1Q23
2,503
70%
1,072
30%
3,574
1Q23
1,960
55%
1,615
45%
3,574
2Q23
3,190
73%
1,184
27%
4,373
2Q23
2,219
51%
2,154
49%
4,373
3Q23
3,429
74%
1,189
26%
4,618
3Q23
2,256
49%
2,362
51%
4,618
LTM3Q22
6,988
77%
2,138
23%
9,127
LTM3Q22
5,499
60%
3,628
40%
9,127
LTM3Q23
11,455
72%
4,406
28%
15,862
LTM3Q23
8,180
52%
7,681
48%
15,862
Note: ¹"Pay-in" means a payment transaction whereby dLocal's merchant customers receive payment from their customers. "Pay-out" means a payment transaction whereby dLocal disburses money in local currency to
the business partners or customers of dLocal's merchant customers.
2"Cross-border" means a payment transaction whereby dLocal is collecting in one currency and settling into a different currency and/or in a different geography. "Local-to-local" means a payment transaction whereby
dLocal is collecting and settling in the same currency.
d.
23View entire presentation