Silicon Valley Bank Results Presentation Deck
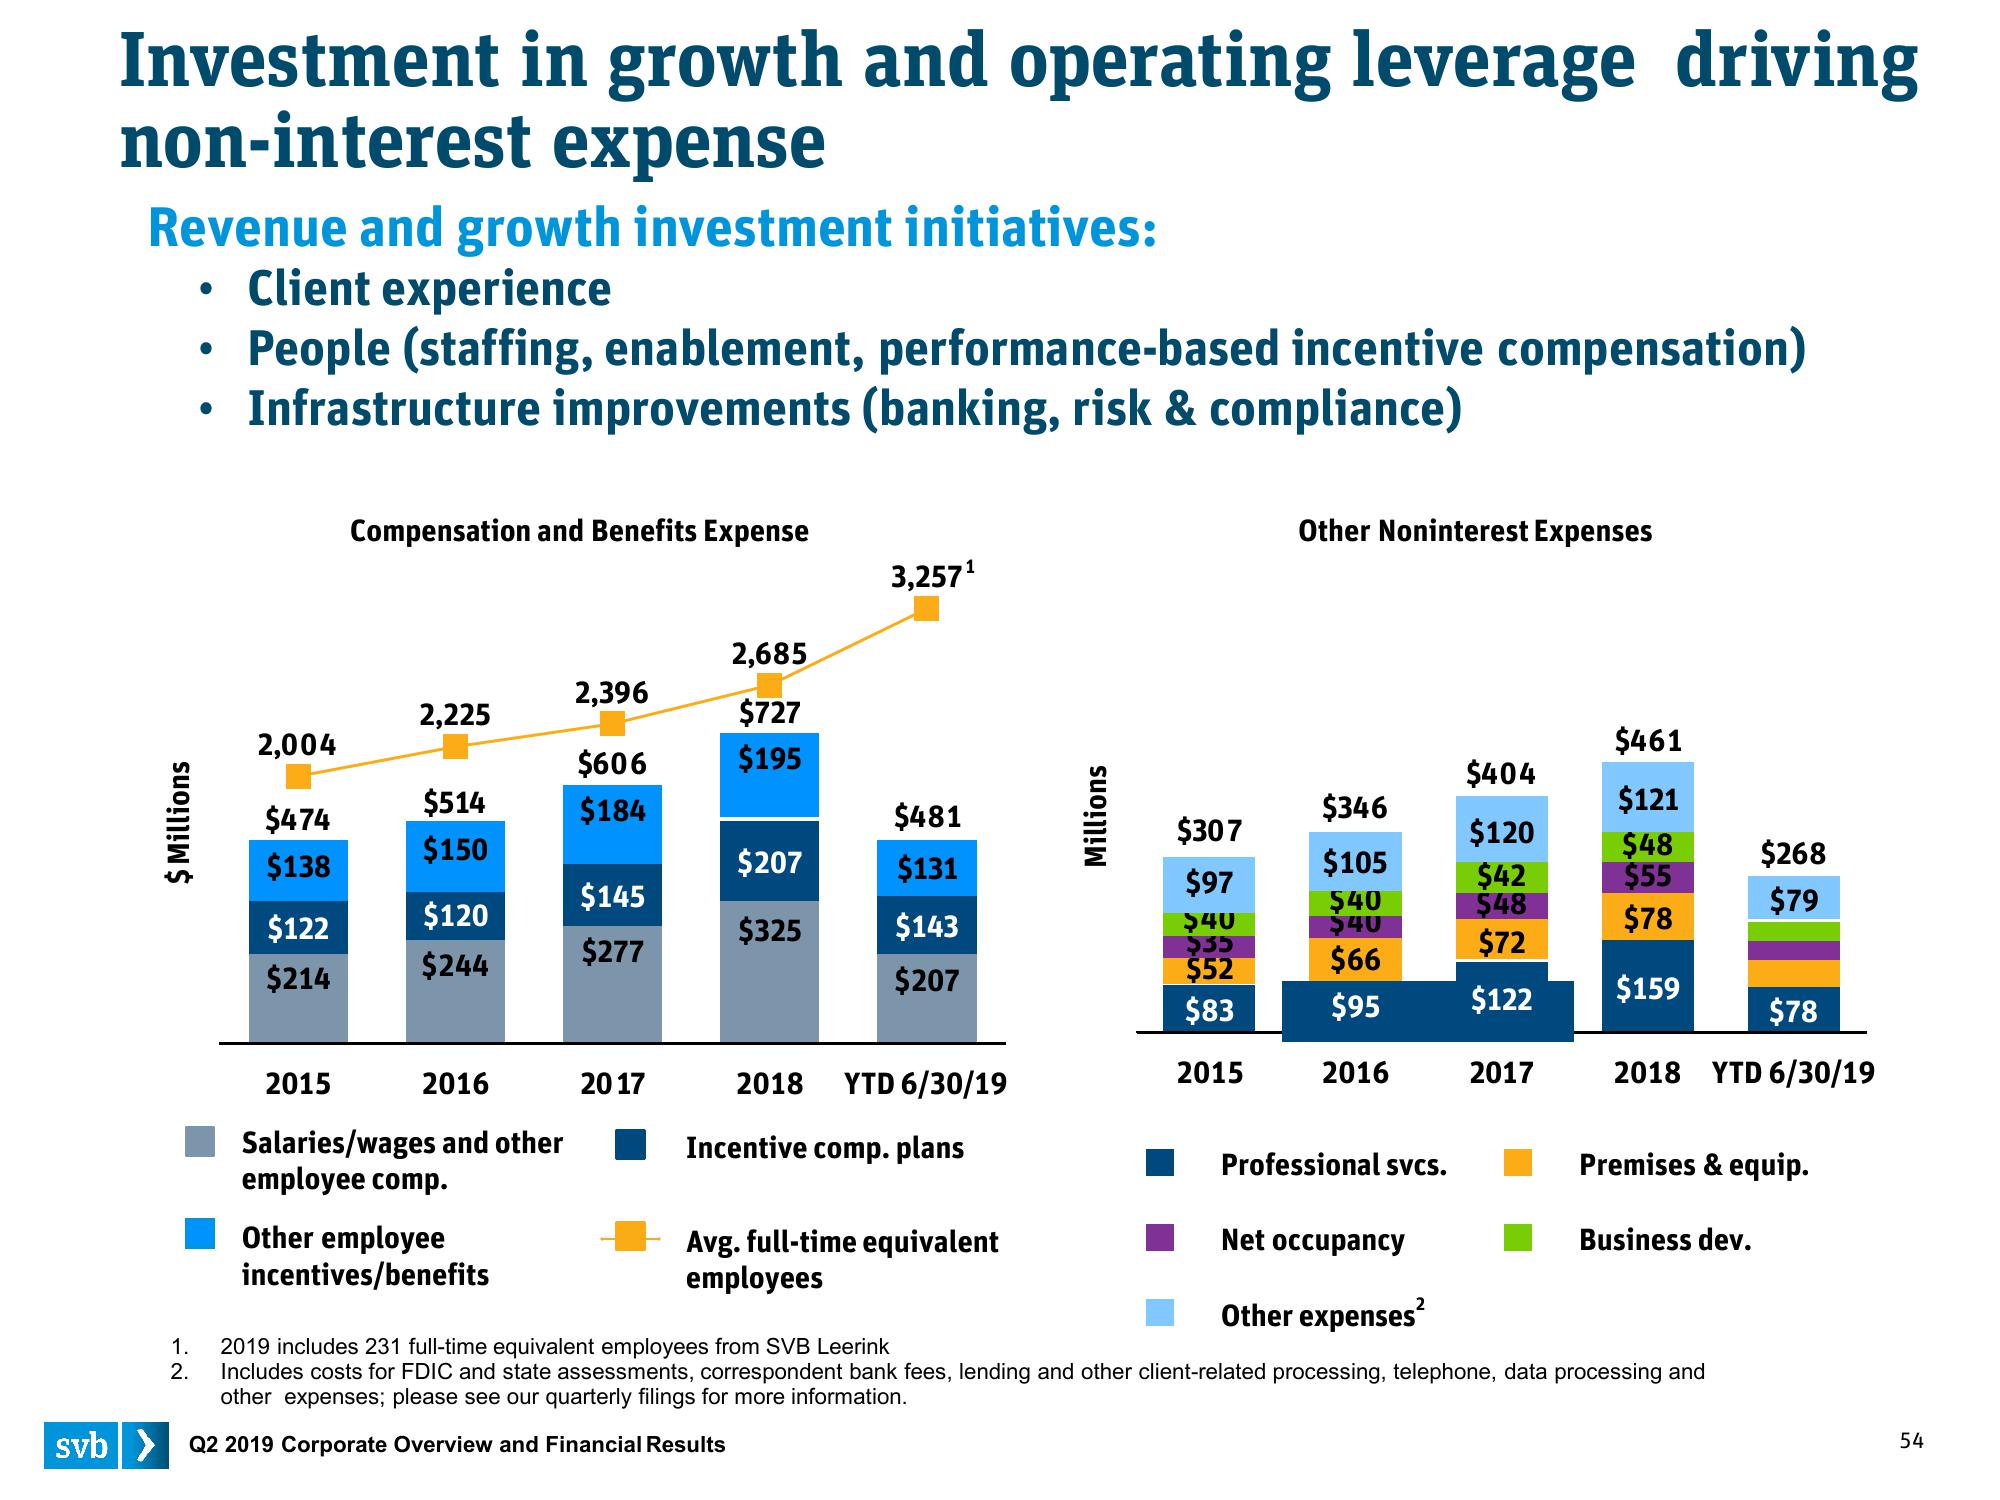
Investment in growth and operating leverage driving
non-interest expense
Revenue and growth investment initiatives:
Client experience
People (staffing, enablement, performance-based incentive compensation)
Infrastructure improvements (banking, risk & compliance)
$ Millions
1.
2.
●
●
2,004
$474
$138
$122
$214
Compensation and Benefits Expense
2015
2,225
$514
$150
$120
$244
2016
Salaries/wages and other
employee comp.
2,396
$606
$184
Other employee
incentives/benefits
$145
$277
2017
2,685
$727
$195
$207
$325
3,257¹
svb> Q2 2019 Corporate Overview and Financial Results
$481
$131
$143
$207
2018 YTD 6/30/19
Incentive comp. plans
Avg. full-time equivalent
employees
Millions
$307
$97
$40
$35
$52
$83
2015
Other Noninterest Expenses
$404
$120
$42
$48
$72
$346
$105
$40
$40
$66
$95 $122
2016
Professional svcs.
2017
$461
$121
$48
$55
$78
$159
Net occupancy
Other expenses²
2019 includes 231 full-time equivalent employees from SVB Leerink
Includes costs for FDIC and state assessments, correspondent bank fees, lending and other client-related processing, telephone, data processing and
other expenses; please see our quarterly filings for more information.
$78
2018 YTD 6/30/19
$268
$79
Premises & equip.
Business dev.
54View entire presentation