Marti Investor Presentation Deck
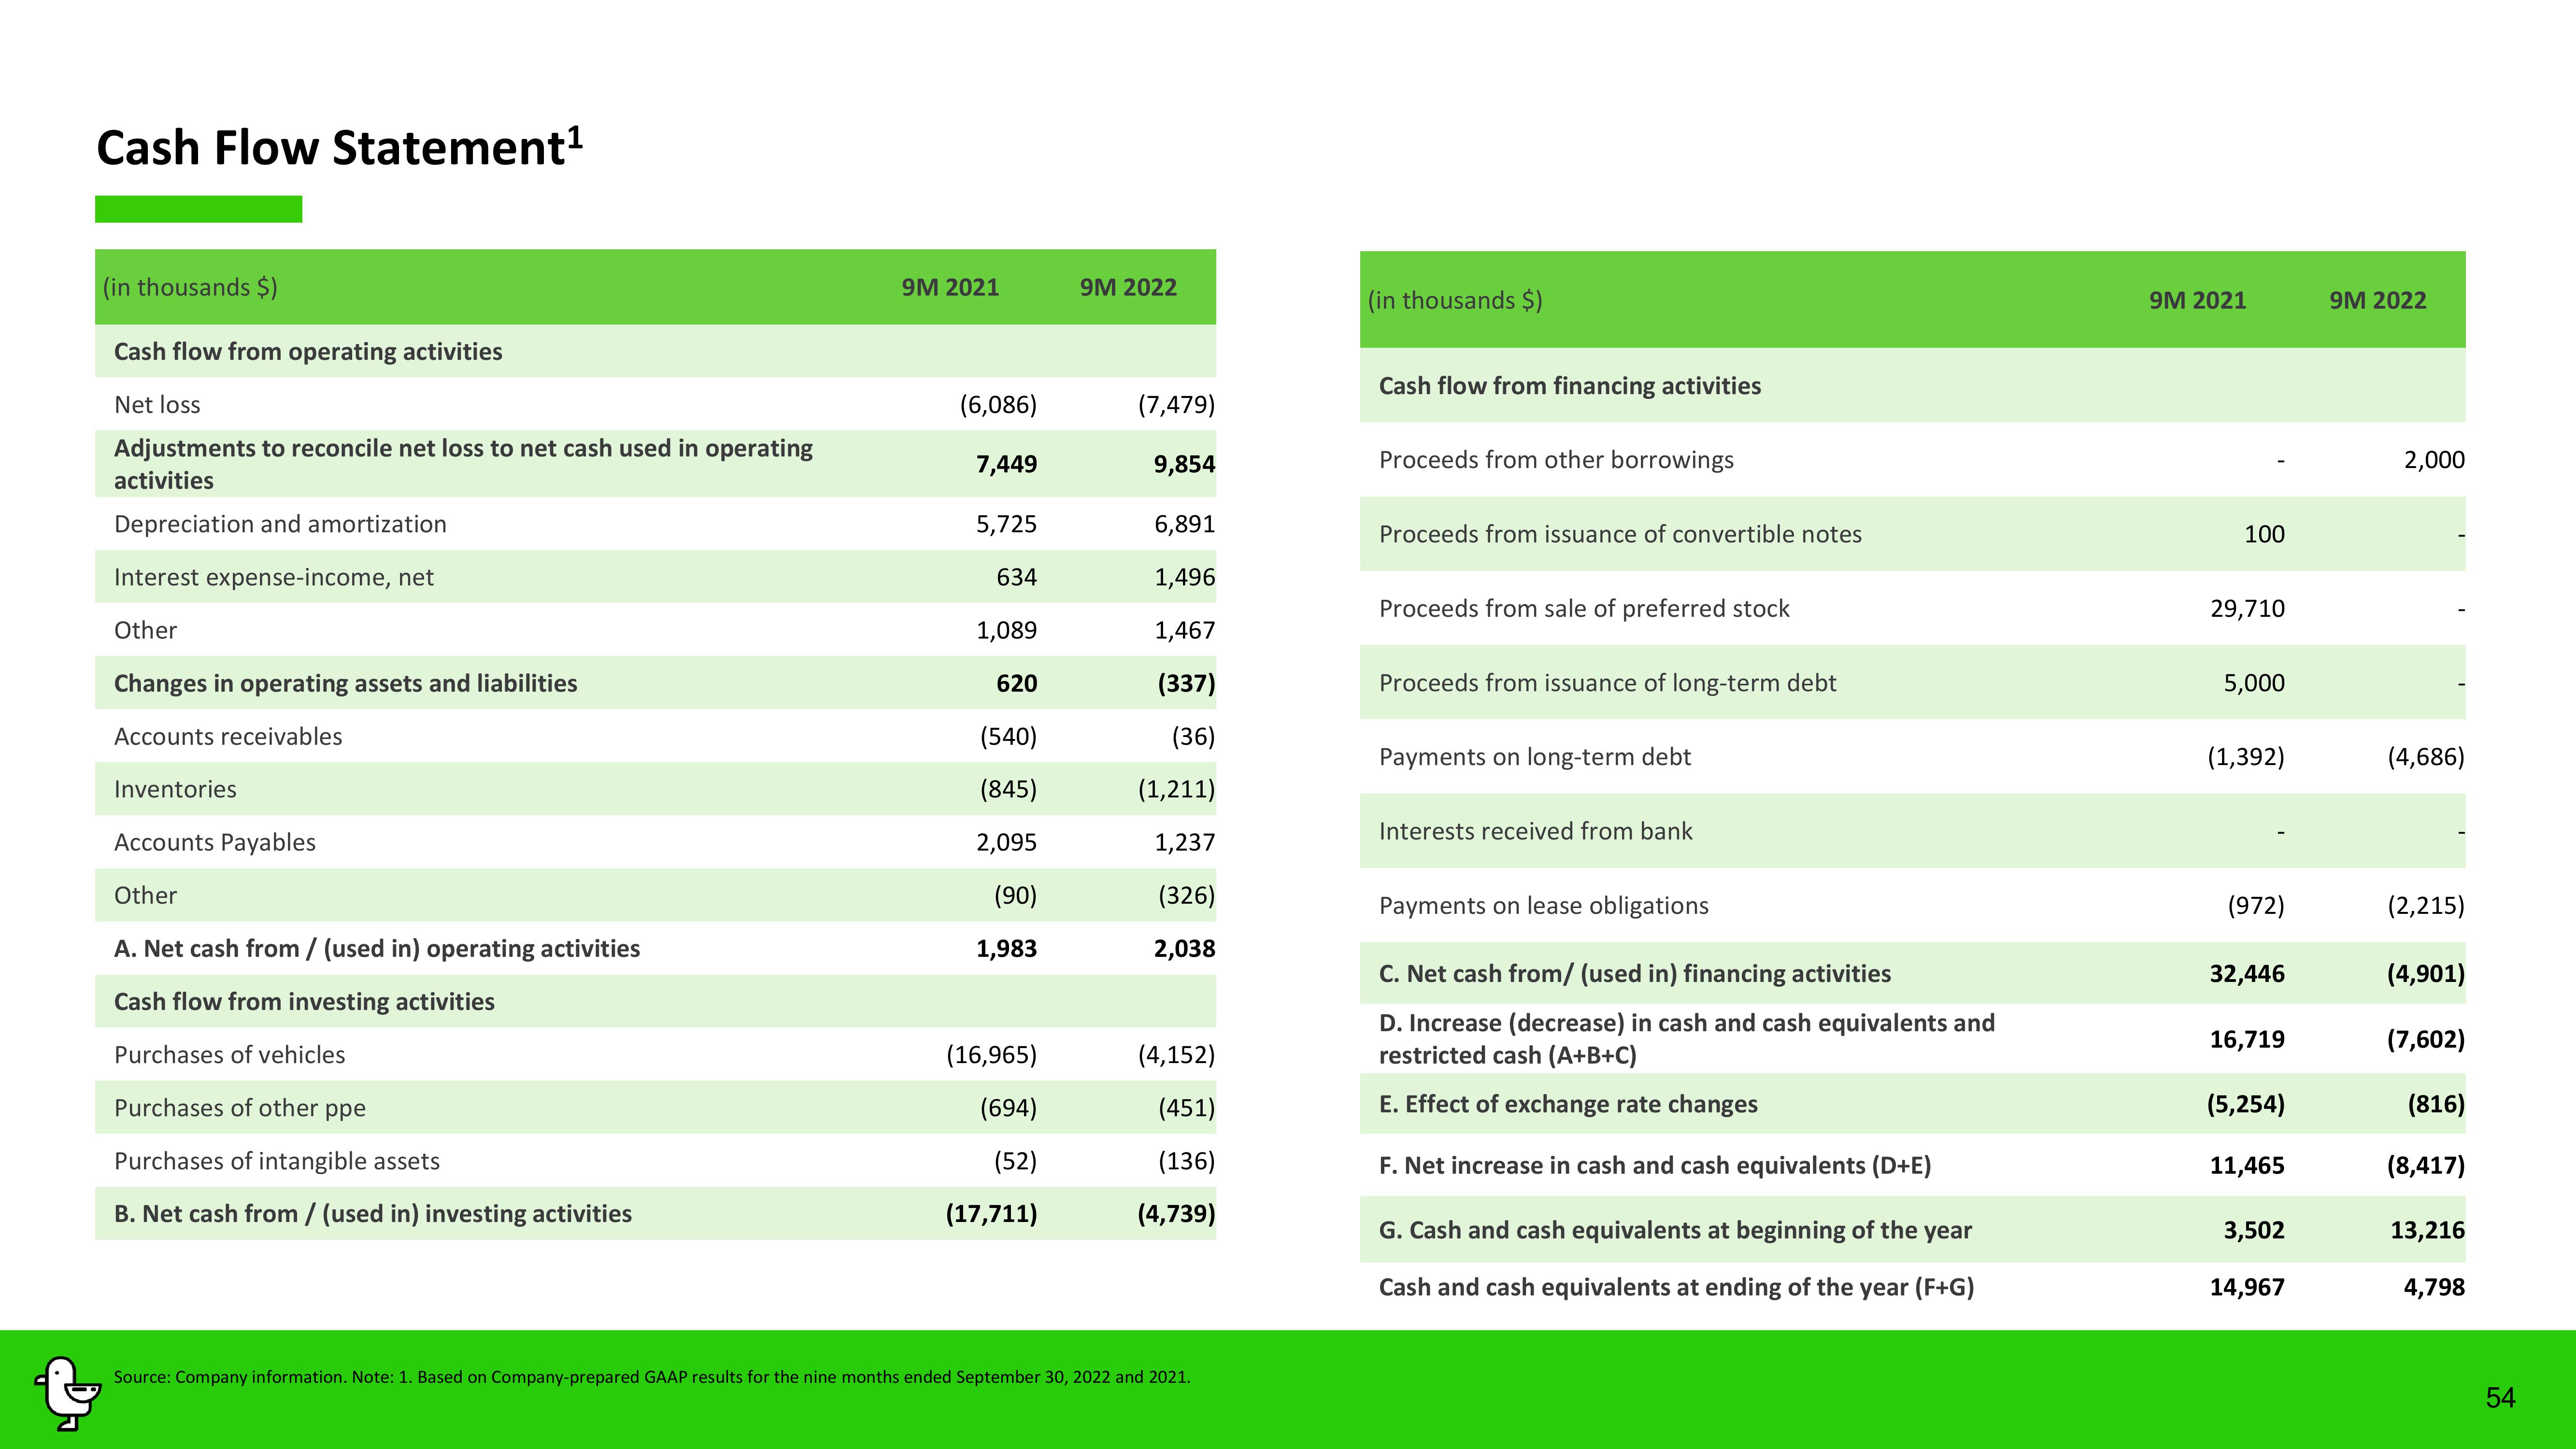
Cash Flow Statement¹
(in thousands $)
Cash flow from operating activities
Net loss
Adjustments to reconcile net loss to net cash used in operating
activities
Depreciation and amortization
Interest expense-income, net
Other
Changes in operating assets and liabilities
Accounts receivables
Inventories
Accounts Payables
Other
A. Net cash from / (used in) operating activities
Cash flow from investing activities
Purchases of vehicles
Purchases of other ppe
Purchases of intangible assets
B. Net cash from / (used in) investing activities
9M 2021
(6,086)
7,449
5,725
634
1,089
620
(540)
(845)
2,095
(90)
1,983
(16,965)
(694)
(52)
(17,711)
9M 2022
(7,479)
9,854
6,891
1,496
1,467
(337)
(36)
(1,211)
1,237
(326)
2,038
(4,152)
(451)
(136)
(4,739)
Source: Company information. Note: 1. Based on Company-prepared GAAP results for the nine months ended September 30, 2022 and 2021.
(in thousands $)
Cash flow from financing activities
Proceeds from other borrowings
Proceeds from issuance of convertible notes
Proceeds from sale of preferred stock
Proceeds from issuance of long-term debt
Payments on long-term debt
Interests received from bank
Payments on lease obligations
C. Net cash from/ (used in) financing activities
D. Increase (decrease) in cash and cash equivalents and
restricted cash (A+B+C)
E. Effect of exchange rate changes
F. Net increase in cash and cash equivalents (D+E)
G. Cash and cash equivalents at beginning of the year
Cash and cash equivalents at ending of the year (F+G)
9M 2021
100
29,710
5,000
(1,392)
(972)
32,446
16,719
(5,254)
11,465
3,502
14,967
9M 2022
2,000
(4,686)
(2,215)
(4,901)
(7,602)
(816)
(8,417)
13,216
4,798
54View entire presentation