Tudor, Pickering, Holt & Co Investment Banking
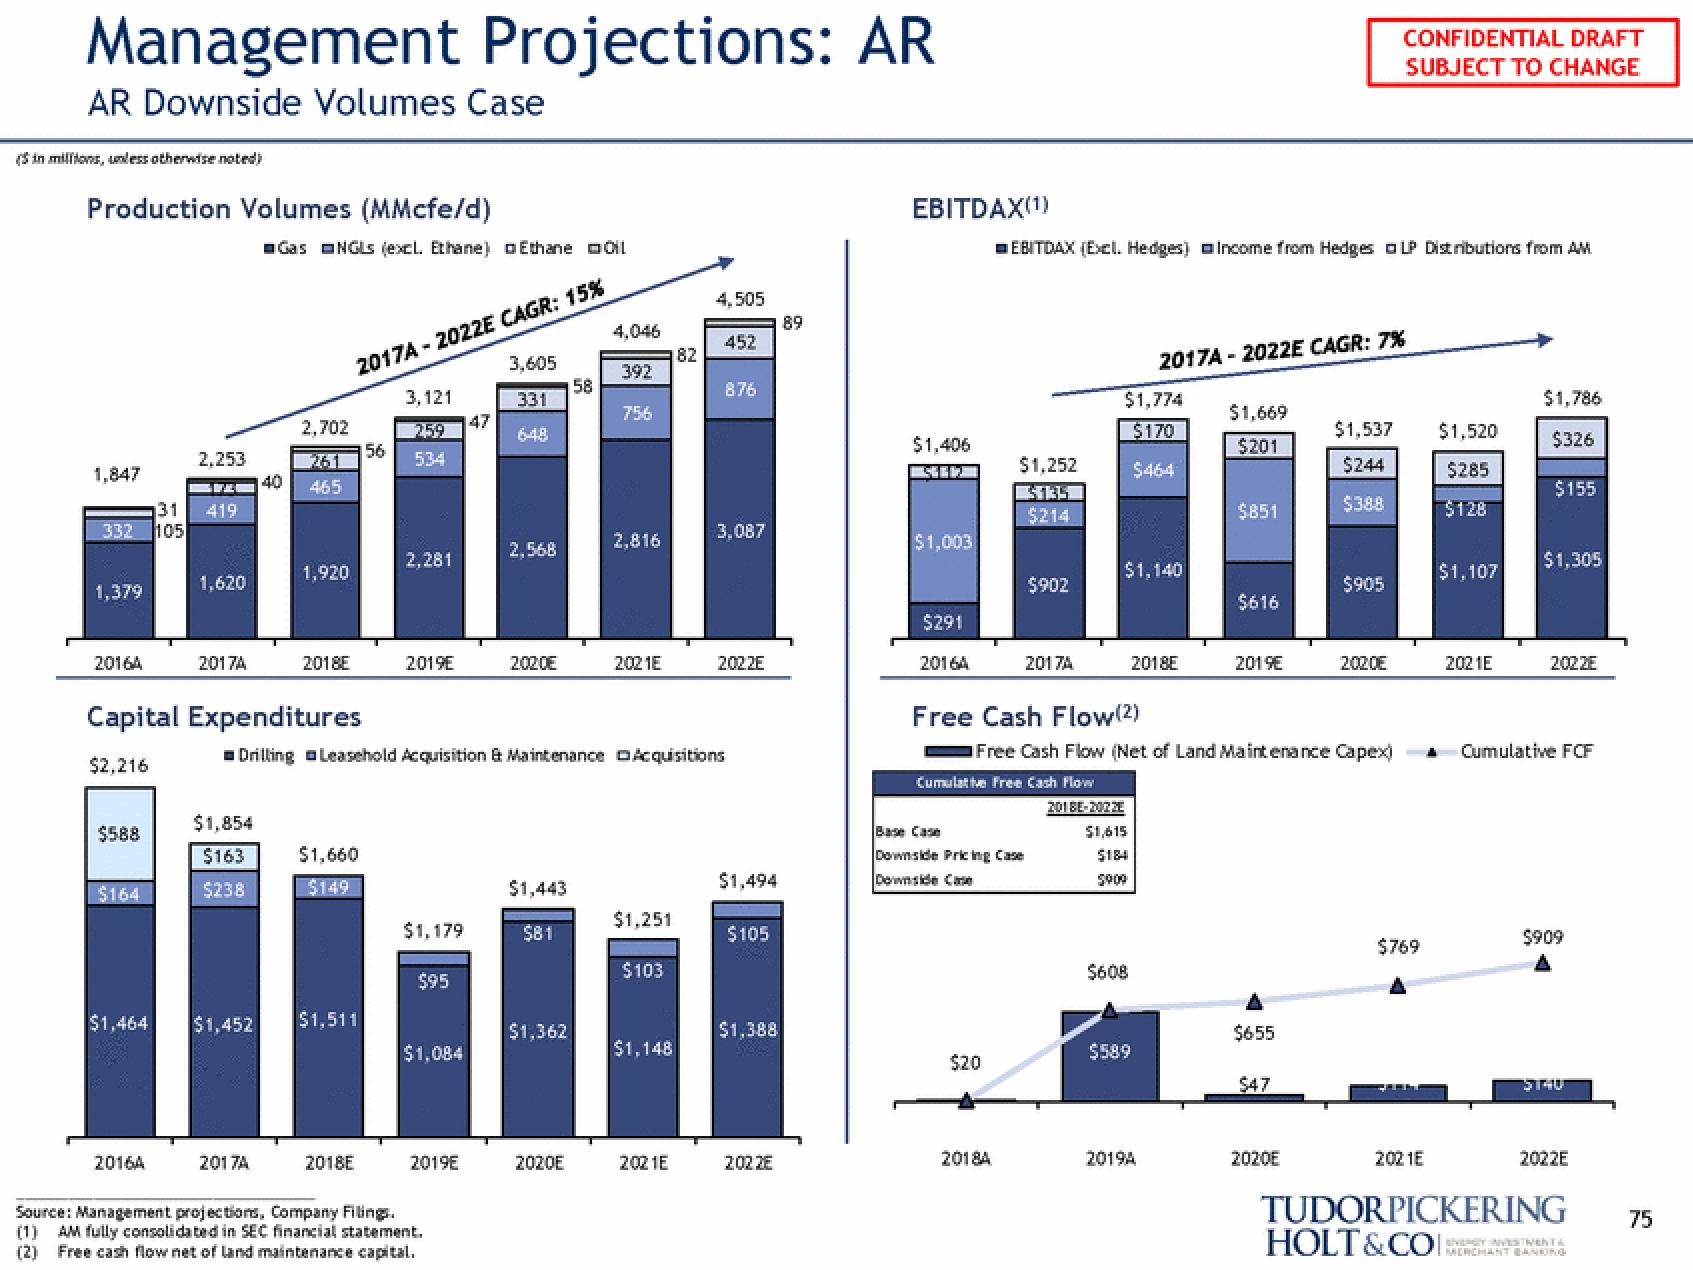
Management Projections: AR
AR Downside Volumes Case
(in millions, unless otherwise noted)
Production Volumes (MMcfe/d)
1,847
332 105
1,379
2016A
$588
$164
$1,464
2,253
131 419
2016A
1,620
2017A
Gas ONGLS (excl. Ethane) o Ethane Oil
Capital Expenditures
$2,216
$1,854
$163
$238
2,702
40 465
2017A
1,920
2018E
2017A-2022E CAGR: 15%
$1,660
$149
$1,452 $1,511
2018E
56
3,121
259
534
2,281
2019E
$1,179
$95
$1,084
147
2019E
3,605
331
6-48
Source: Management projections, Company Filing.
(1) AM fully consolidated in SEC financial statement.
(2) Free cash flow net of land maintenance capital.
2,568
2020E
☐Drilling Leasehold Acquisition & Maintenance Acquisitions
$1,443
$81
$1,362
58
2020E
4,046
392
756
2,816
2021E
$1,251
$103
182
$1,148
2021E
4,505
452
876
3,087
2022E
$1,494
$105
$1,388
202 ZE
89
EBITDAX(1)
$1,406
$1,003
$291
2016A
EBITDAX (Excl. Hedges) Income from Hedges OLP Distributions from AM.
$1,252
$20
$214
20184
$902
2017A
Base Case
Downside Pricing Case
Cumulative Free Cash Flow
Free Cash Flow (2)
$1,774
$170
$464
$1,140
2018E-2022E
$1,615
$184
5909
2018E
$608
2017A-2022E CAGR: 7%
Free Cash Flow (Net of Land Maintenance Capex)
$589
2019A
$1,669
$201
$851
$616
2019E
$655
$47
2020E
CONFIDENTIAL DRAFT
SUBJECT TO CHANGE
$1,537 $1,520
$244
$285
$388
$128
$905
2020E
$769
2021E
$1,107
2021E
$1,786
$326
$155
$1,305
2022E
Cumulative FCF
$909
$140
2022E
TUDORPICKERING
HOLT&CO
SIVERY INVESTMENT
75View entire presentation