Bank of America Results Presentation Deck
Consumer Banking
Summary Income Statement ($MM)
Total revenue, net of interest expense
Provision (benefit) for credit losses
Noninterest expense
Pretax income
Pretax, pre-provision income¹
Income tax expense
Net income
Key Indicators ($B)
Average deposits
Rate paid on deposits
Cost of deposits²
Average loans and leases
Net charge-off ratio
Net charge-offs ($MM)
Reserve build (release) ($MM)
Consumer investment assets³
Active mobile banking users (MM)
% Consumer sales through digital channels
Number of financial centers
Combined credit/debit purchase volumes¹
Total consumer credit card risk-adjusted margin¹
Return on average allocated capital
Allocated capital
Efficiency ratio
3Q22
$9,904
738
5,097
4,069
4,807
997
$3,072
3Q22
$1,069.1
0.03 %
1.17
$295.2
0.69%
$512
226
$302.4
34.9
48 %
3,932
$218.2
10.07 %
30
$40.0
51 %
Inc / (Dec)
2Q22
$768
388
138
242
630
59
$183
2Q22
$1,078.0
0.02 %
1.14
$289.6
0.70%
$502
(152)
$315.2
34.2
48 %
3,984
$220.5
9.95 %
29
$40.0
54 %
3Q21
$1,066
491
539
36
527
9
$27
3Q21
$1,000.8
0.02 %
1.09
$281.4
0.69 %
$489
(242)
$353.3
32.5
43 %
4,215
$200.6
10.70 %
31
$38.5
52 %
.
.
.
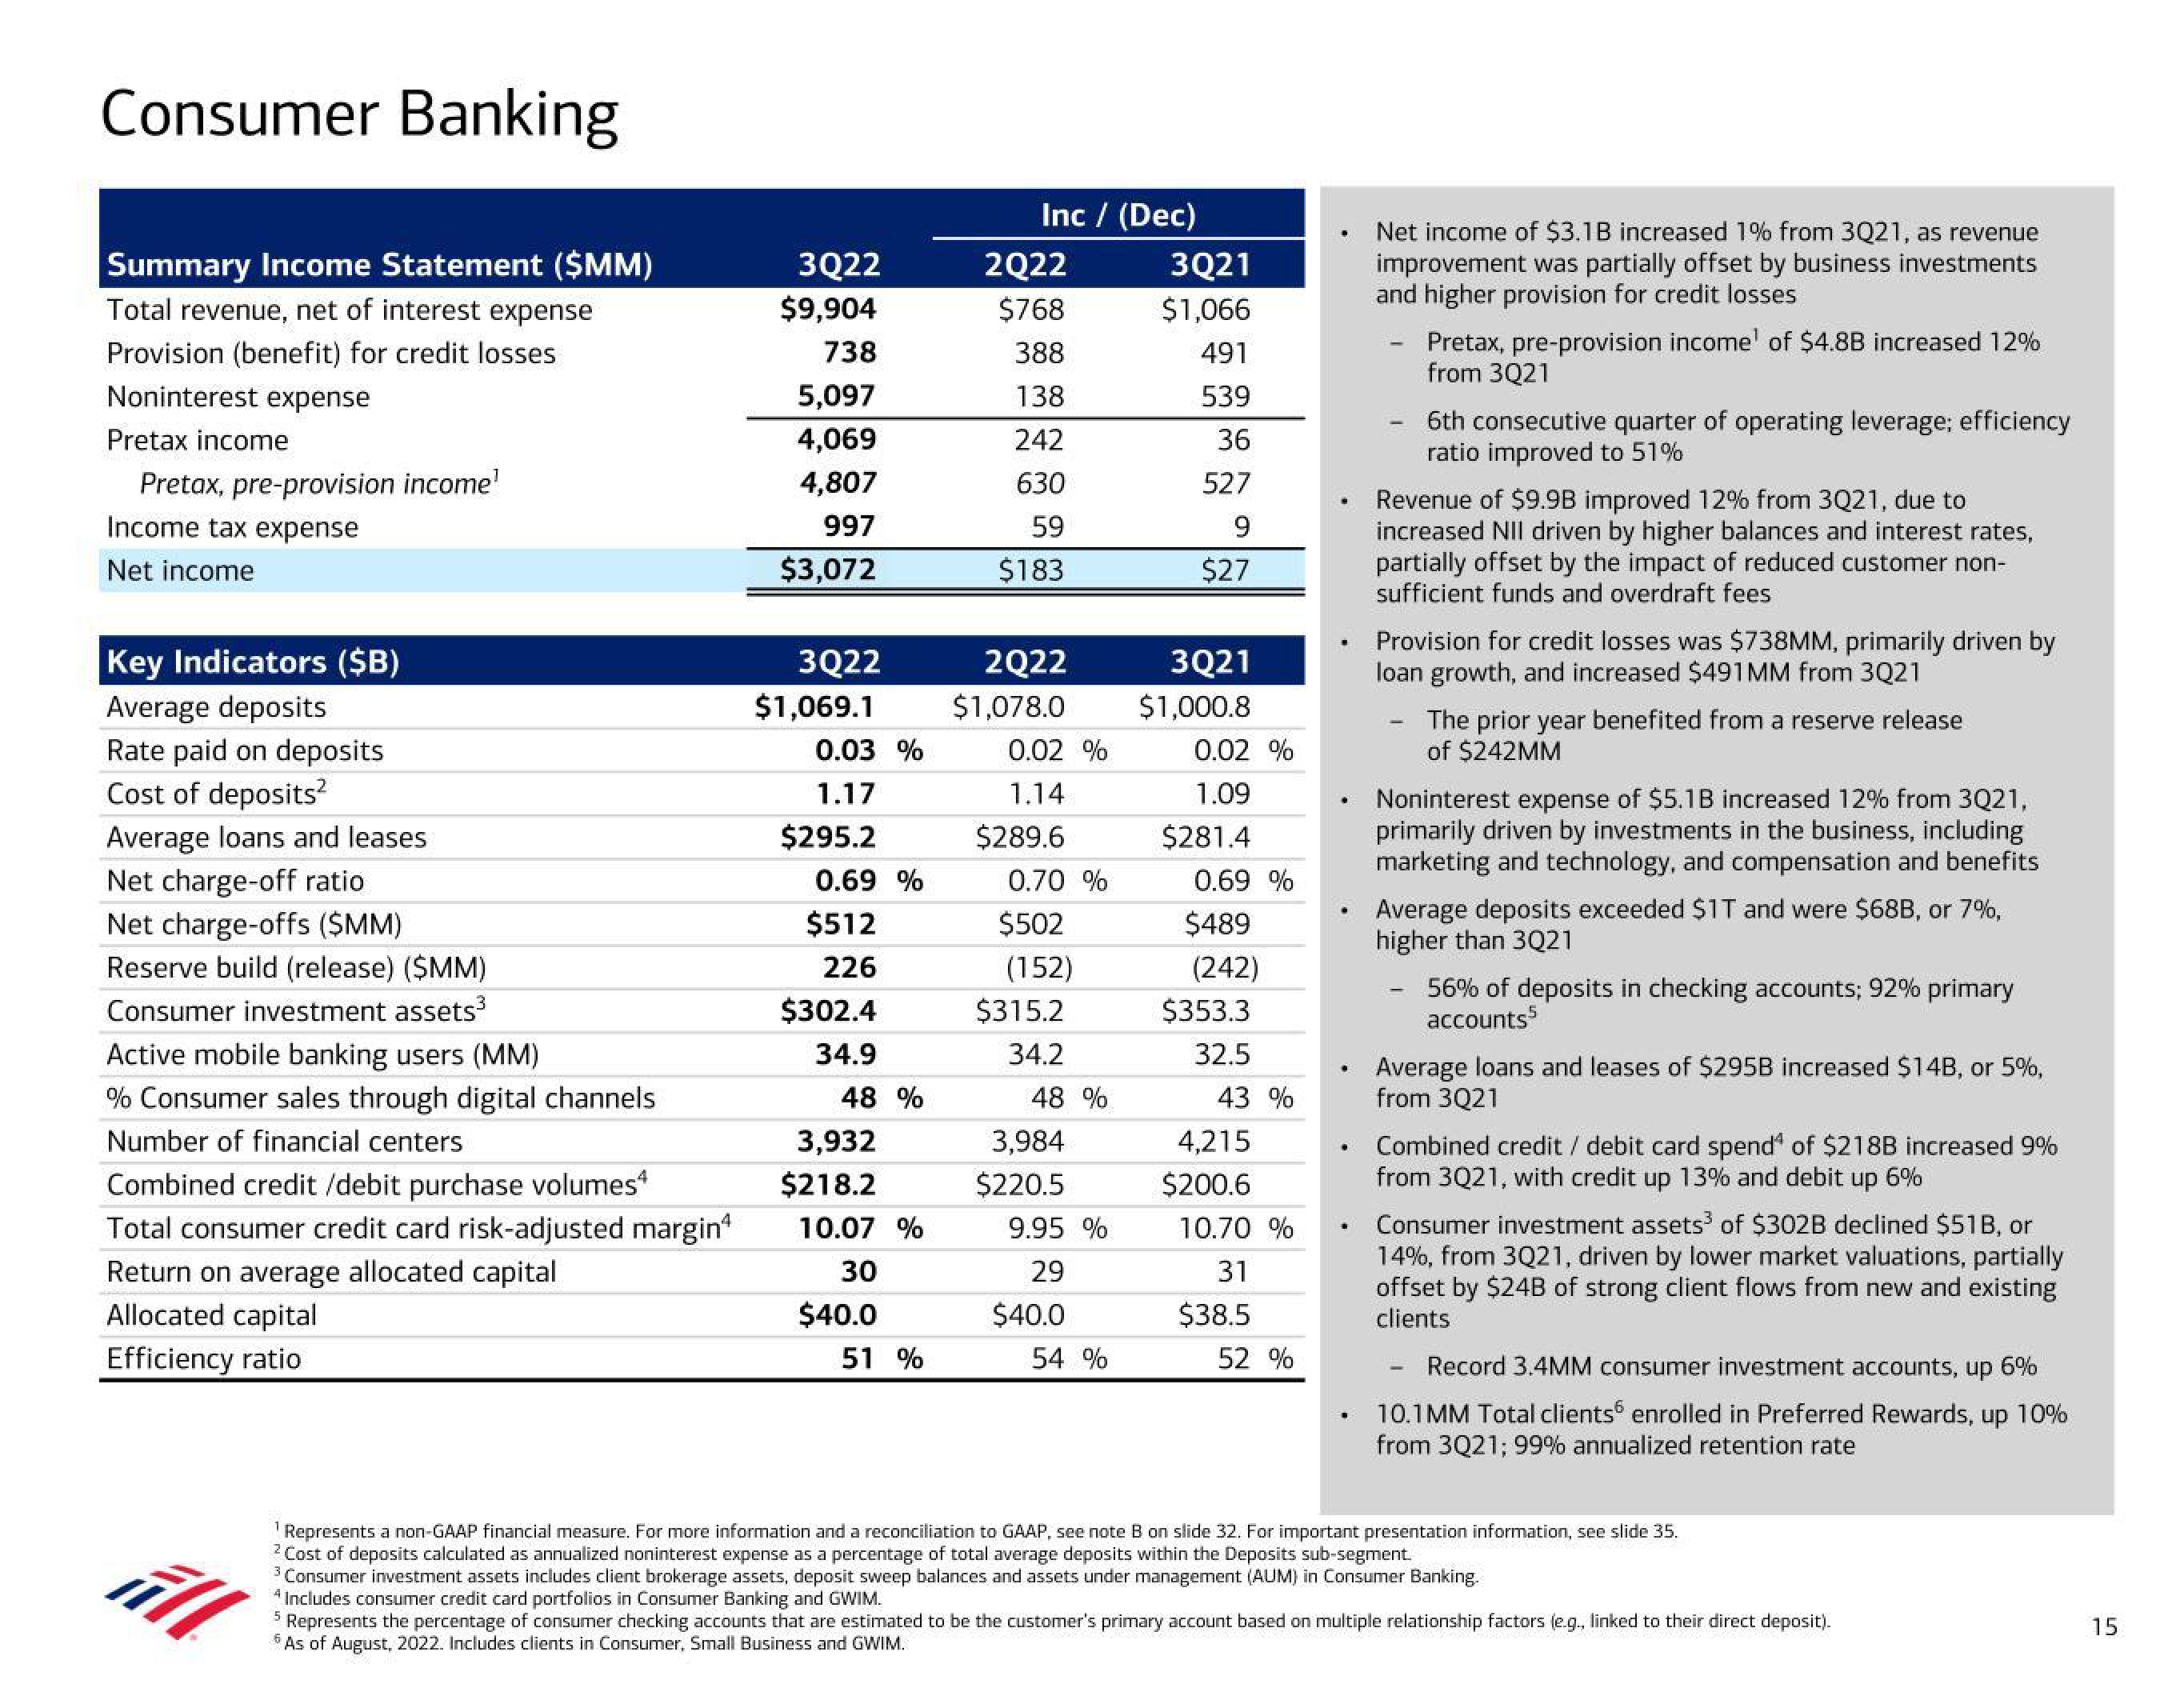
Net income of $3.1B increased 1% from 3Q21, as revenue
improvement was partially offset by business investments
and higher provision for credit losses
Pretax, pre-provision income¹ of $4.8B increased 12%
from 3Q21
6th consecutive quarter of operating leverage; efficiency
ratio improved to 51%
Revenue of $9.9B improved 12% from 3Q21, due to
increased NII driven by higher balances and interest rates,
partially offset by the impact of reduced customer non-
sufficient funds and overdraft fees
Provision for credit losses was $738MM, primarily driven by
loan growth, and increased $491MM from 3Q21
-
The prior year benefited from a reserve release
of $242MM
Noninterest expense of $5.1B increased 12% from 3Q21,
primarily driven by investments in the business, including
marketing and technology, and compensation and benefits
Average deposits exceeded $1T and were $68B, or 7%,
higher than 3Q21
56% of deposits in checking accounts; 92% primary
accounts5
Average loans and leases of $295B increased $14B, or 5%,
from 3Q21
Combined credit/debit card spend of $218B increased 9%
from 3Q21, with credit up 13% and debit up 6%
Consumer investment assets³ of $302B declined $51B, or
14%, from 3Q21, driven by lower market valuations, partially
offset by $24B of strong client flows from new and existing
clients
Record 3.4MM consumer investment accounts, up 6%
10.1 MM Total clients enrolled in Preferred Rewards, up 10%
from 3Q21; 99% annualized retention rate
¹Represents a non-GAAP financial measure. For more information and a reconciliation to GAAP, see note B on slide 32. For important presentation information, see slide 35.
2 Cost of deposits calculated as annualized noninterest expense as a percentage of total average deposits within the Deposits sub-segment.
3
All
³ Consumer investment assets includes client brokerage assets, deposit sweep balances and assets under management (AUM) in Consumer Banking.
4 Includes consumer credit card portfolios in Consumer Banking and GWIM.
5 Represents the percentage of consumer checking accounts that are estimated to be the customer's primary account based on multiple relationship factors (e.g., linked to their direct deposit).
6 As of August, 2022. Includes clients in Consumer, Small Business and GWIM.
15View entire presentation