The Global Solar Photovoltaic Supply Chain and Bottom-UP Cost Model Results
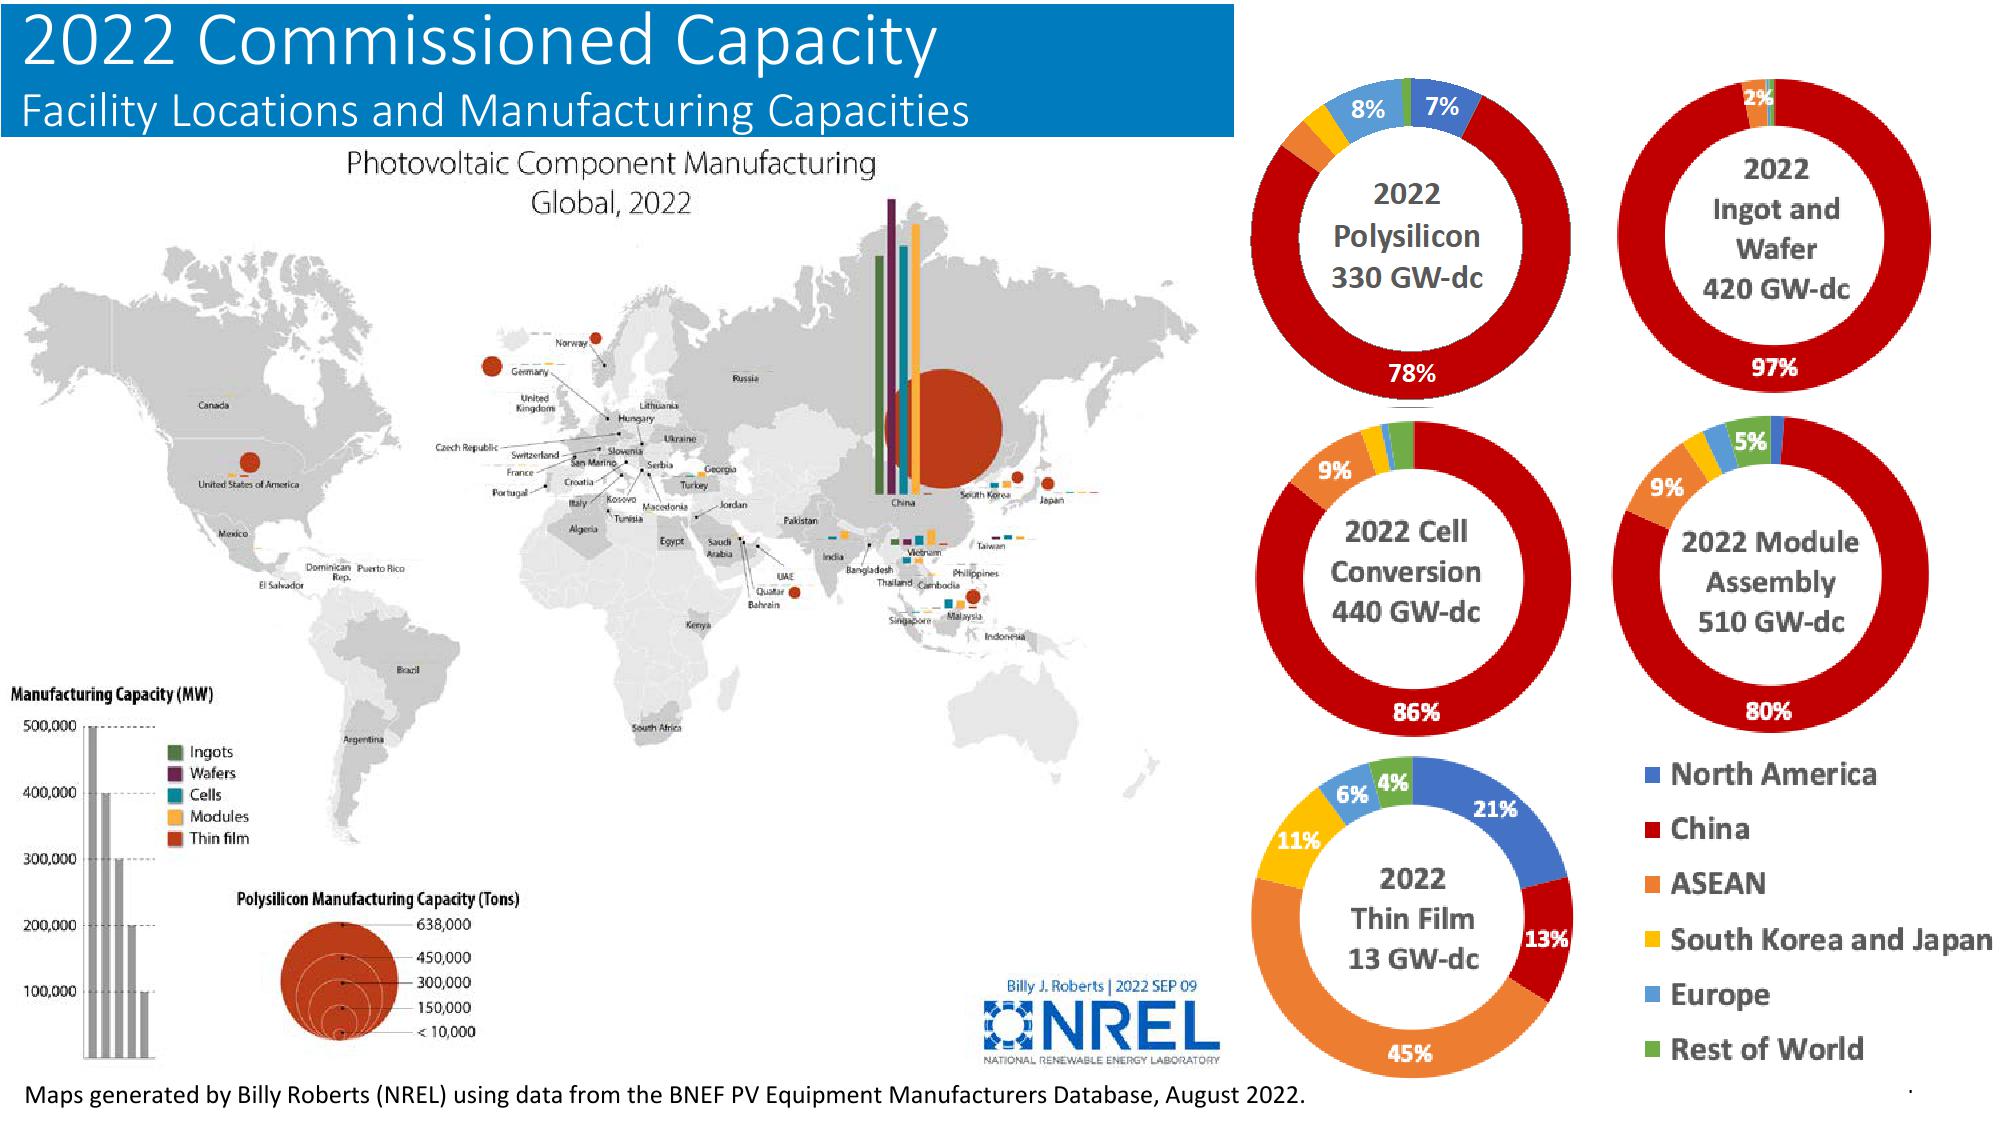
2022 Commissioned Capacity
Facility Locations and Manufacturing Capacities
Photovoltaic Component Manufacturing
Global, 2022
Canada
United States of America
Manufacturing Capacity (MW)
500,000
Mexico
El Salvador
Dominican Puerto Rico
Rep.
Argentina
Ingots
Wafers
400,000
Cells
Modules
Thin film
300,000
Baril
Germany
United
Kingdom
Norway
Lithuan
Hungary
Ukraine
Russia
Czech Republic
Switzerland
Slowenia
San Marino
Serbia
France
Georgia
Croatia
Turkey
Portugal-
Maly Kosovo Macedonis
Jordan
Tunisia
Pakistan
Algeria
Egypt Saudi
Arabia
Polysilicon Manufacturing Capacity (Tons)
South Africa
South Korea
China
Japan
Taiwan
Philippines
Thailand Cambodia
India
Bangladesh
UAE
Qustar
Bahrain
Kenya
Singapore
Indon
8%
7%
2022
Polysilicon
330 GW-dc
2022
Ingot and
Wafer
420 GW-dc
78%
97%
9%
2022 Cell
Conversion
440 GW-dc
5%
9%
2022 Module
Assembly
510 GW-dc
86%
4%
6%
21%
11%
2022
Thin Film
13%
13 GW-dc
200,000
100,000
638,000
450,000
-300,000
150,000
< 10,000
Billy J. Roberts | 2022 SEP 09
ONREL
NATIONAL RENEWABLE ENERGY LABORATORY
Maps generated by Billy Roberts (NREL) using data from the BNEF PV Equipment Manufacturers Database, August 2022.
45%
80%
■ North America
■ China
■ ASEAN
■South Korea and Japan
■ Europe
■Rest of WorldView entire presentation