Credit Suisse Investment Banking Pitch Book
CONFIDENTIAL
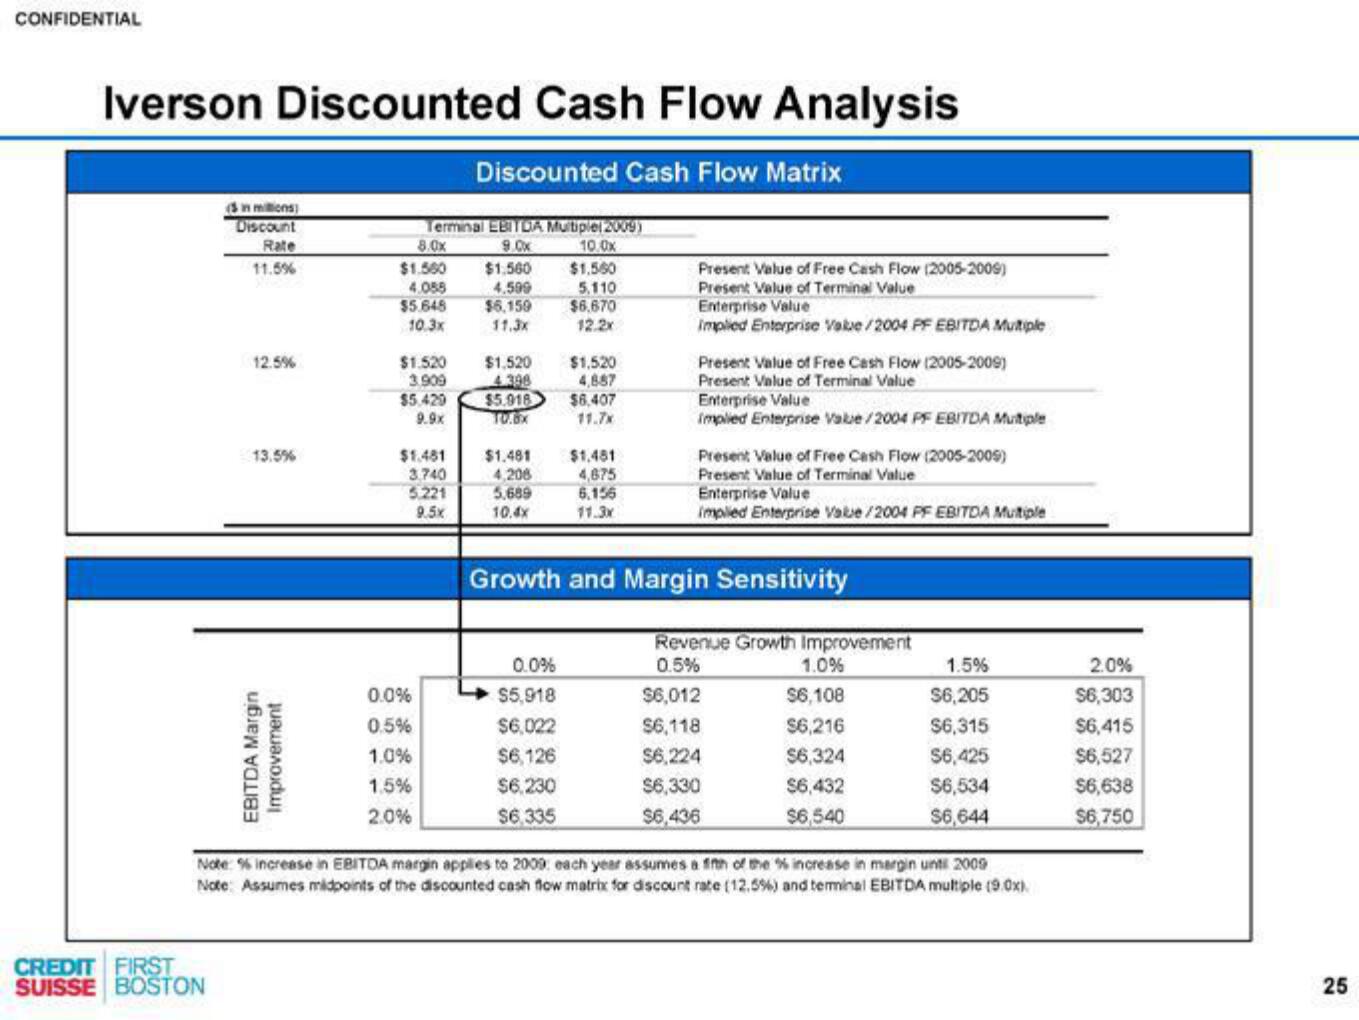
Iverson Discounted Cash Flow Analysis
Discounted Cash Flow Matrix
(in millions)
Discount
Rate
11.5%
CREDIT FIRST
SUISSE BOSTON
12.5%
13.5%
EBITDA Margin
Improvement
Terminal EBITDA Multiplel 2009)
9.0x
8.0x
$1.500
4.055
$5.648
10.3x
$1.520
3.909
$5,429
9.9x
$1.481
3.740
5.221
9.5x
0.0%
0.5%
1.0%
1.5%
2.0%
$1,560
4.599
$6,159
11.3x
$1,520
4.398
$5.918
10.8x
$1.481
4,206
5,689
10.4x
10.0x
$1,560
5.110
$6.670
12.2x
0.0%
$5,918
$6,022
$6,126
$6,230
$6,335
$1,520
4,857
$6,407
$1,481
4,675
6,156
11.3x
Present Value of Free Cash Flow (2005-2009)
Present Value of Terminal Value
Enterprise Value
Implied Enterprise Value/2004 PF EBITDA Multiple
Present Value of Free Cash Flow (2005-2009)
Present Value of Terminal Value
Enterprise Value
implied Enterprise Value/2004 PF EBITDA Multiple
Present Value of Free Cash Flow (2005-2005)
Present Value of Terminal Value
Enterprise Value
implied Enterprise Value/2004 PF EBITDA Multiple
Growth and Margin Sensitivity
Revenue Growth Improvement
0.5%
$6,012
$6,118
$6,224
$6,330
$6,436
1.0%
$6,108
$6,216
$6,324
$6,432
$6,540
1.5%
$6,205
$6,315
$6,425
$6,534
$6,644
Note: % increase in EBITDA margin applies to 2009: each year assumes a fifth of the % increase in margin until 2009
Note: Assumes midpoints of the discounted cash flow matrix for discount rate (12,5%) and terminal EBITDA multiple (9.0x).
2.0%
$6,303
$6,415
$6,527
$6,638
$6,750
25View entire presentation