Apollo Global Management Investor Day Presentation Deck
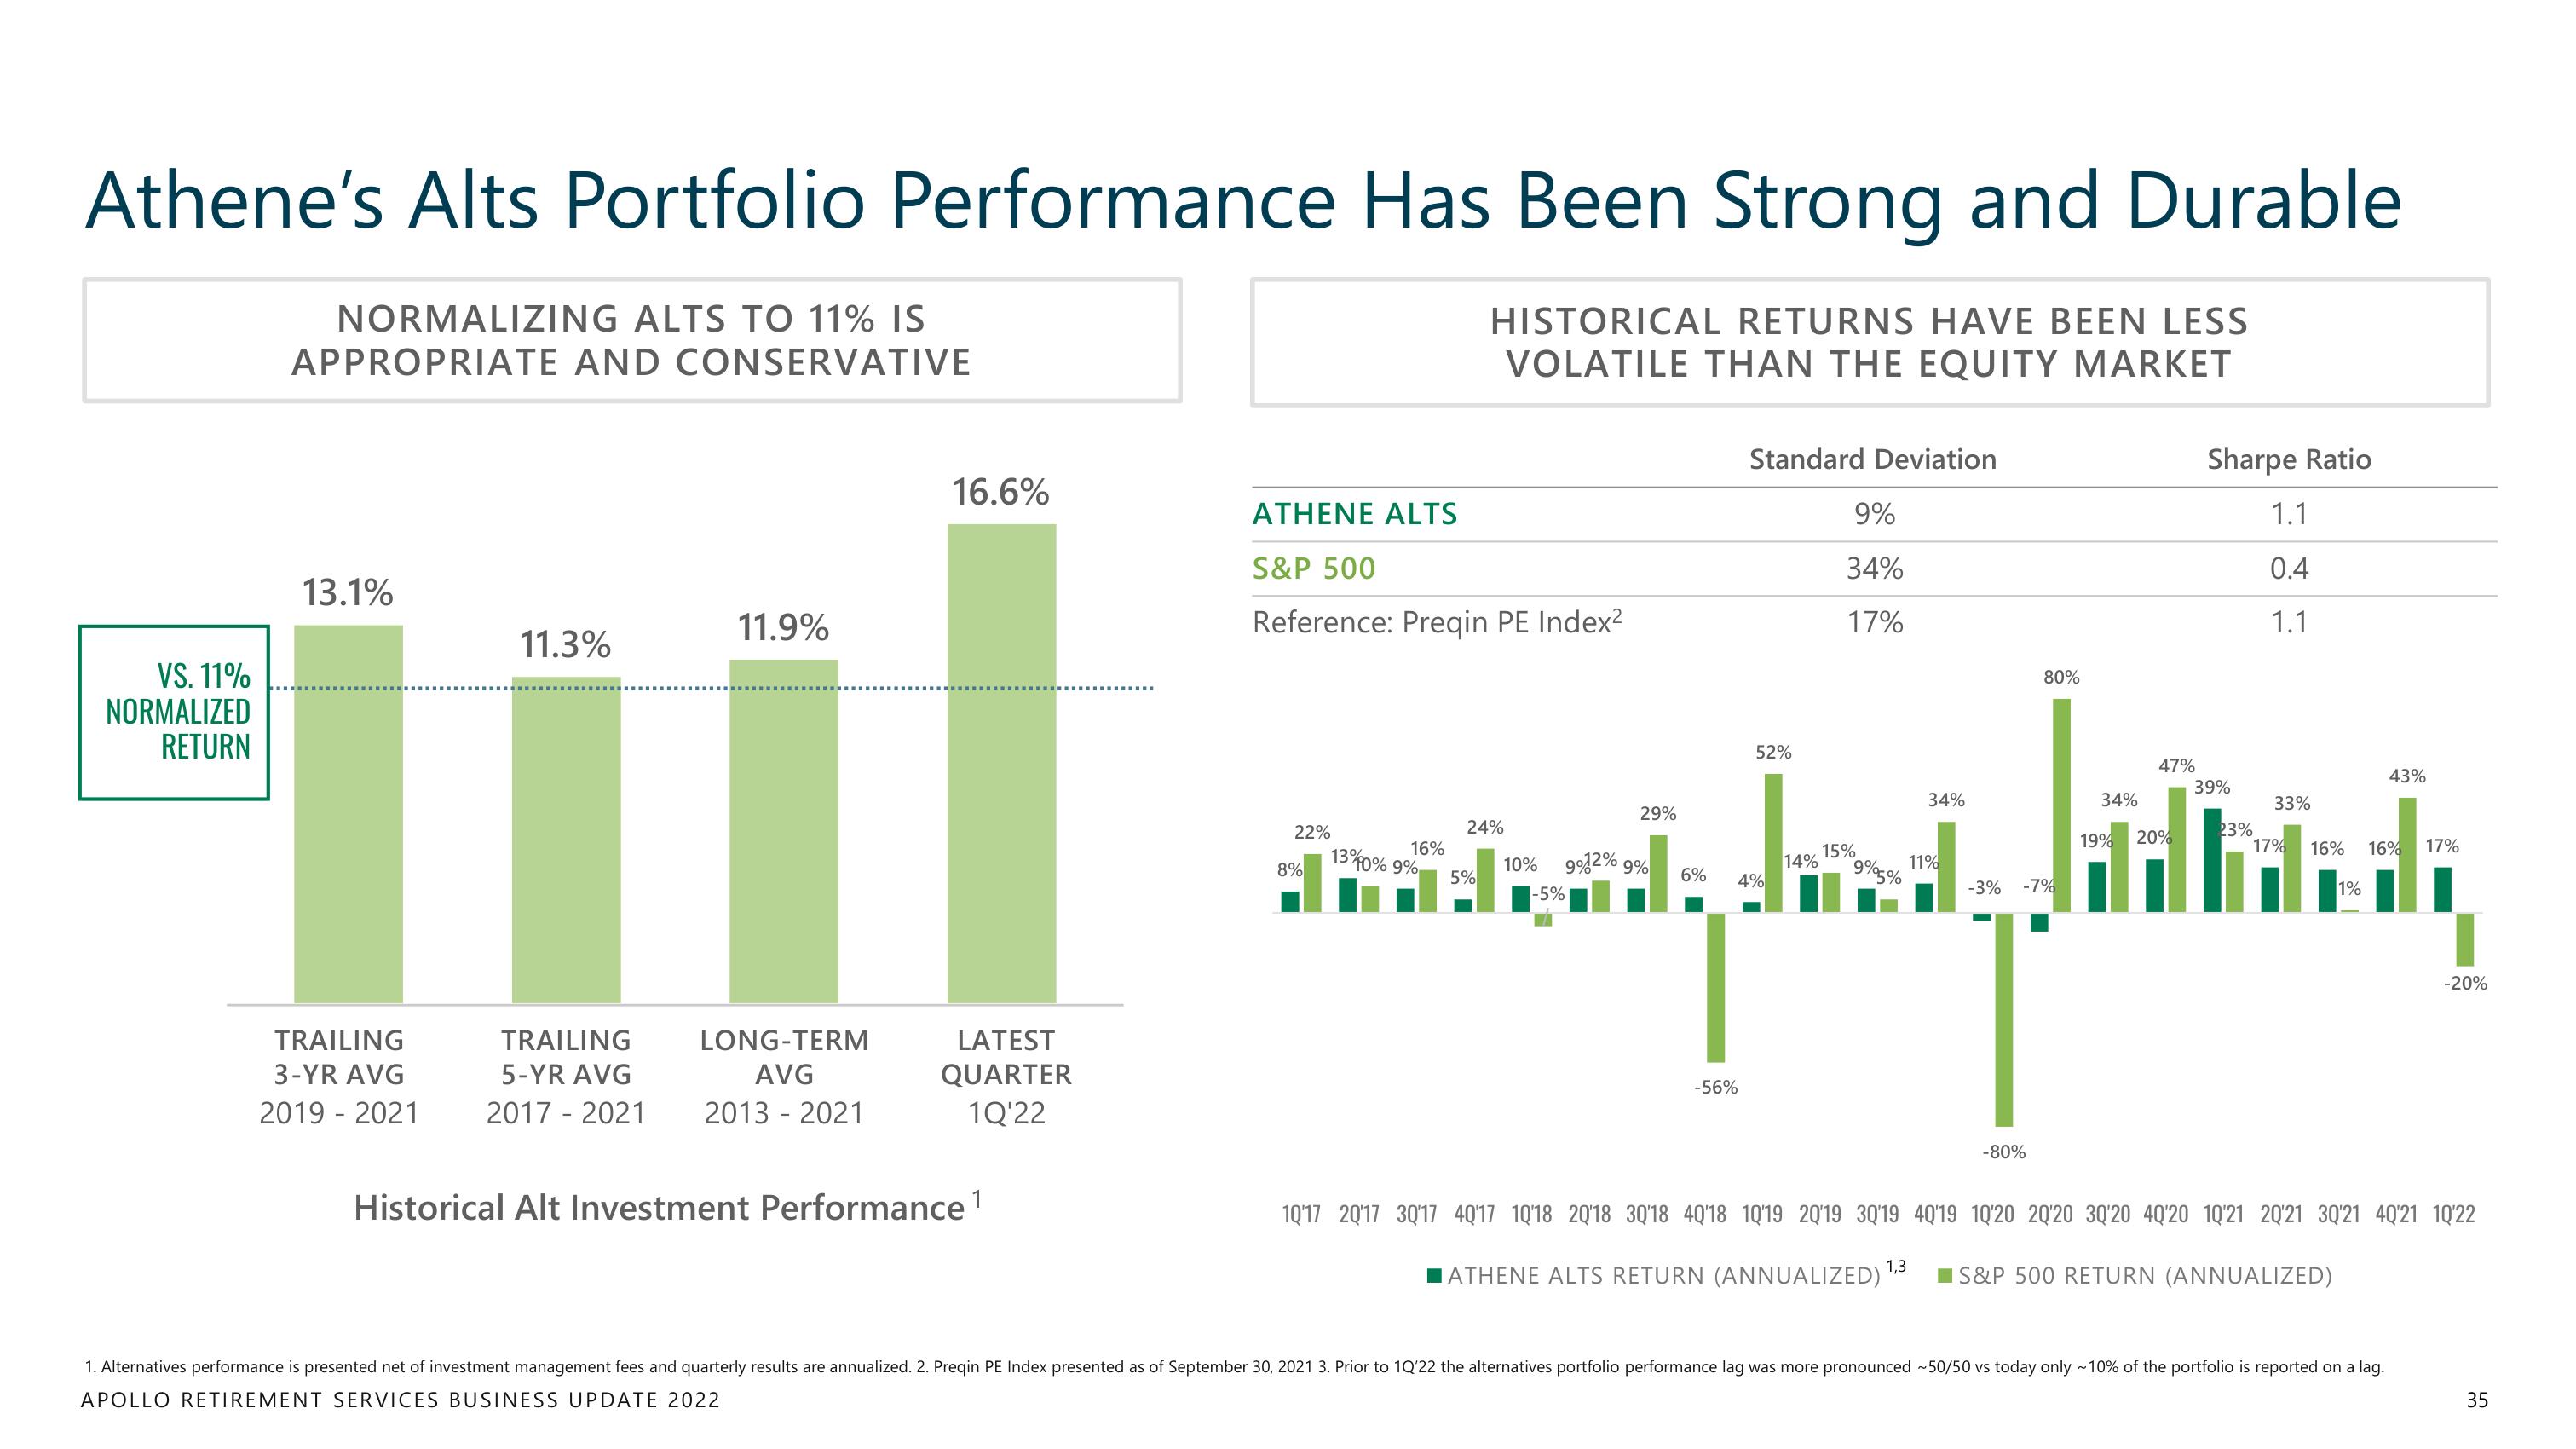
Athene's Alts Portfolio Performance Has Been Strong and Durable
NORMALIZING ALTS TO 11% IS
APPROPRIATE AND CONSERVATIVE
HISTORICAL RETURNS HAVE BEEN LESS
VOLATILE THAN THE EQUITY MARKET
VS. 11%
NORMALIZED
RETURN
13.1%
TRAILING
3-YR AVG
2019 - 2021
11.3%
TRAILING
5-YR AVG
2017 - 2021
11.9%
LONG-TERM
AVG
2013 - 2021
16.6%
LATEST
QUARTER
1Q'22
Historical Alt Investment Performance ¹
ATHENE ALTS
S&P 500
Reference: Preqin PE Index²
22%
8%
13%
Standard Deviation
-56%
52%
9%
34%
17%
34%
34%
29%
24%
19% 20%
16%
15%
14%
10% 9912% 9%
11%
°9%95%
10% 9%
5%
6% 4%
-3% -7%
-5%
amadead, dondguddhindi
endy dand
80%
-80%
47%
Sharpe Ratio
1.1
0.4
1.1
39%
23%
33%
43%
17% 16% 16%
1%
1. Alternatives performance is presented net of investment management fees and quarterly results are annualized. 2. Preqin PE Index presented as of September 30, 2021 3. Prior to 1Q'22 the alternatives portfolio performance lag was more pronounced ~50/50 vs today only ~10% of the portfolio is reported on a lag.
APOLLO RETIREMENT SERVICES BUSINESS UPDATE 2022
17%
-20%
10'17 2017 30'17 4017 10'18 20'18 30'18 4018 10'19 2019 3019 4019 1020 2020 30'20 4020 10'21 20'21 30'21 40'21 10'22
■ATHENE ALTS RETURN (ANNUALIZED) 1,3 S&P 500 RETURN (ANNUALIZED)
35View entire presentation