Kore SPAC Presentation Deck
Operational Benchmarking (cont'd)
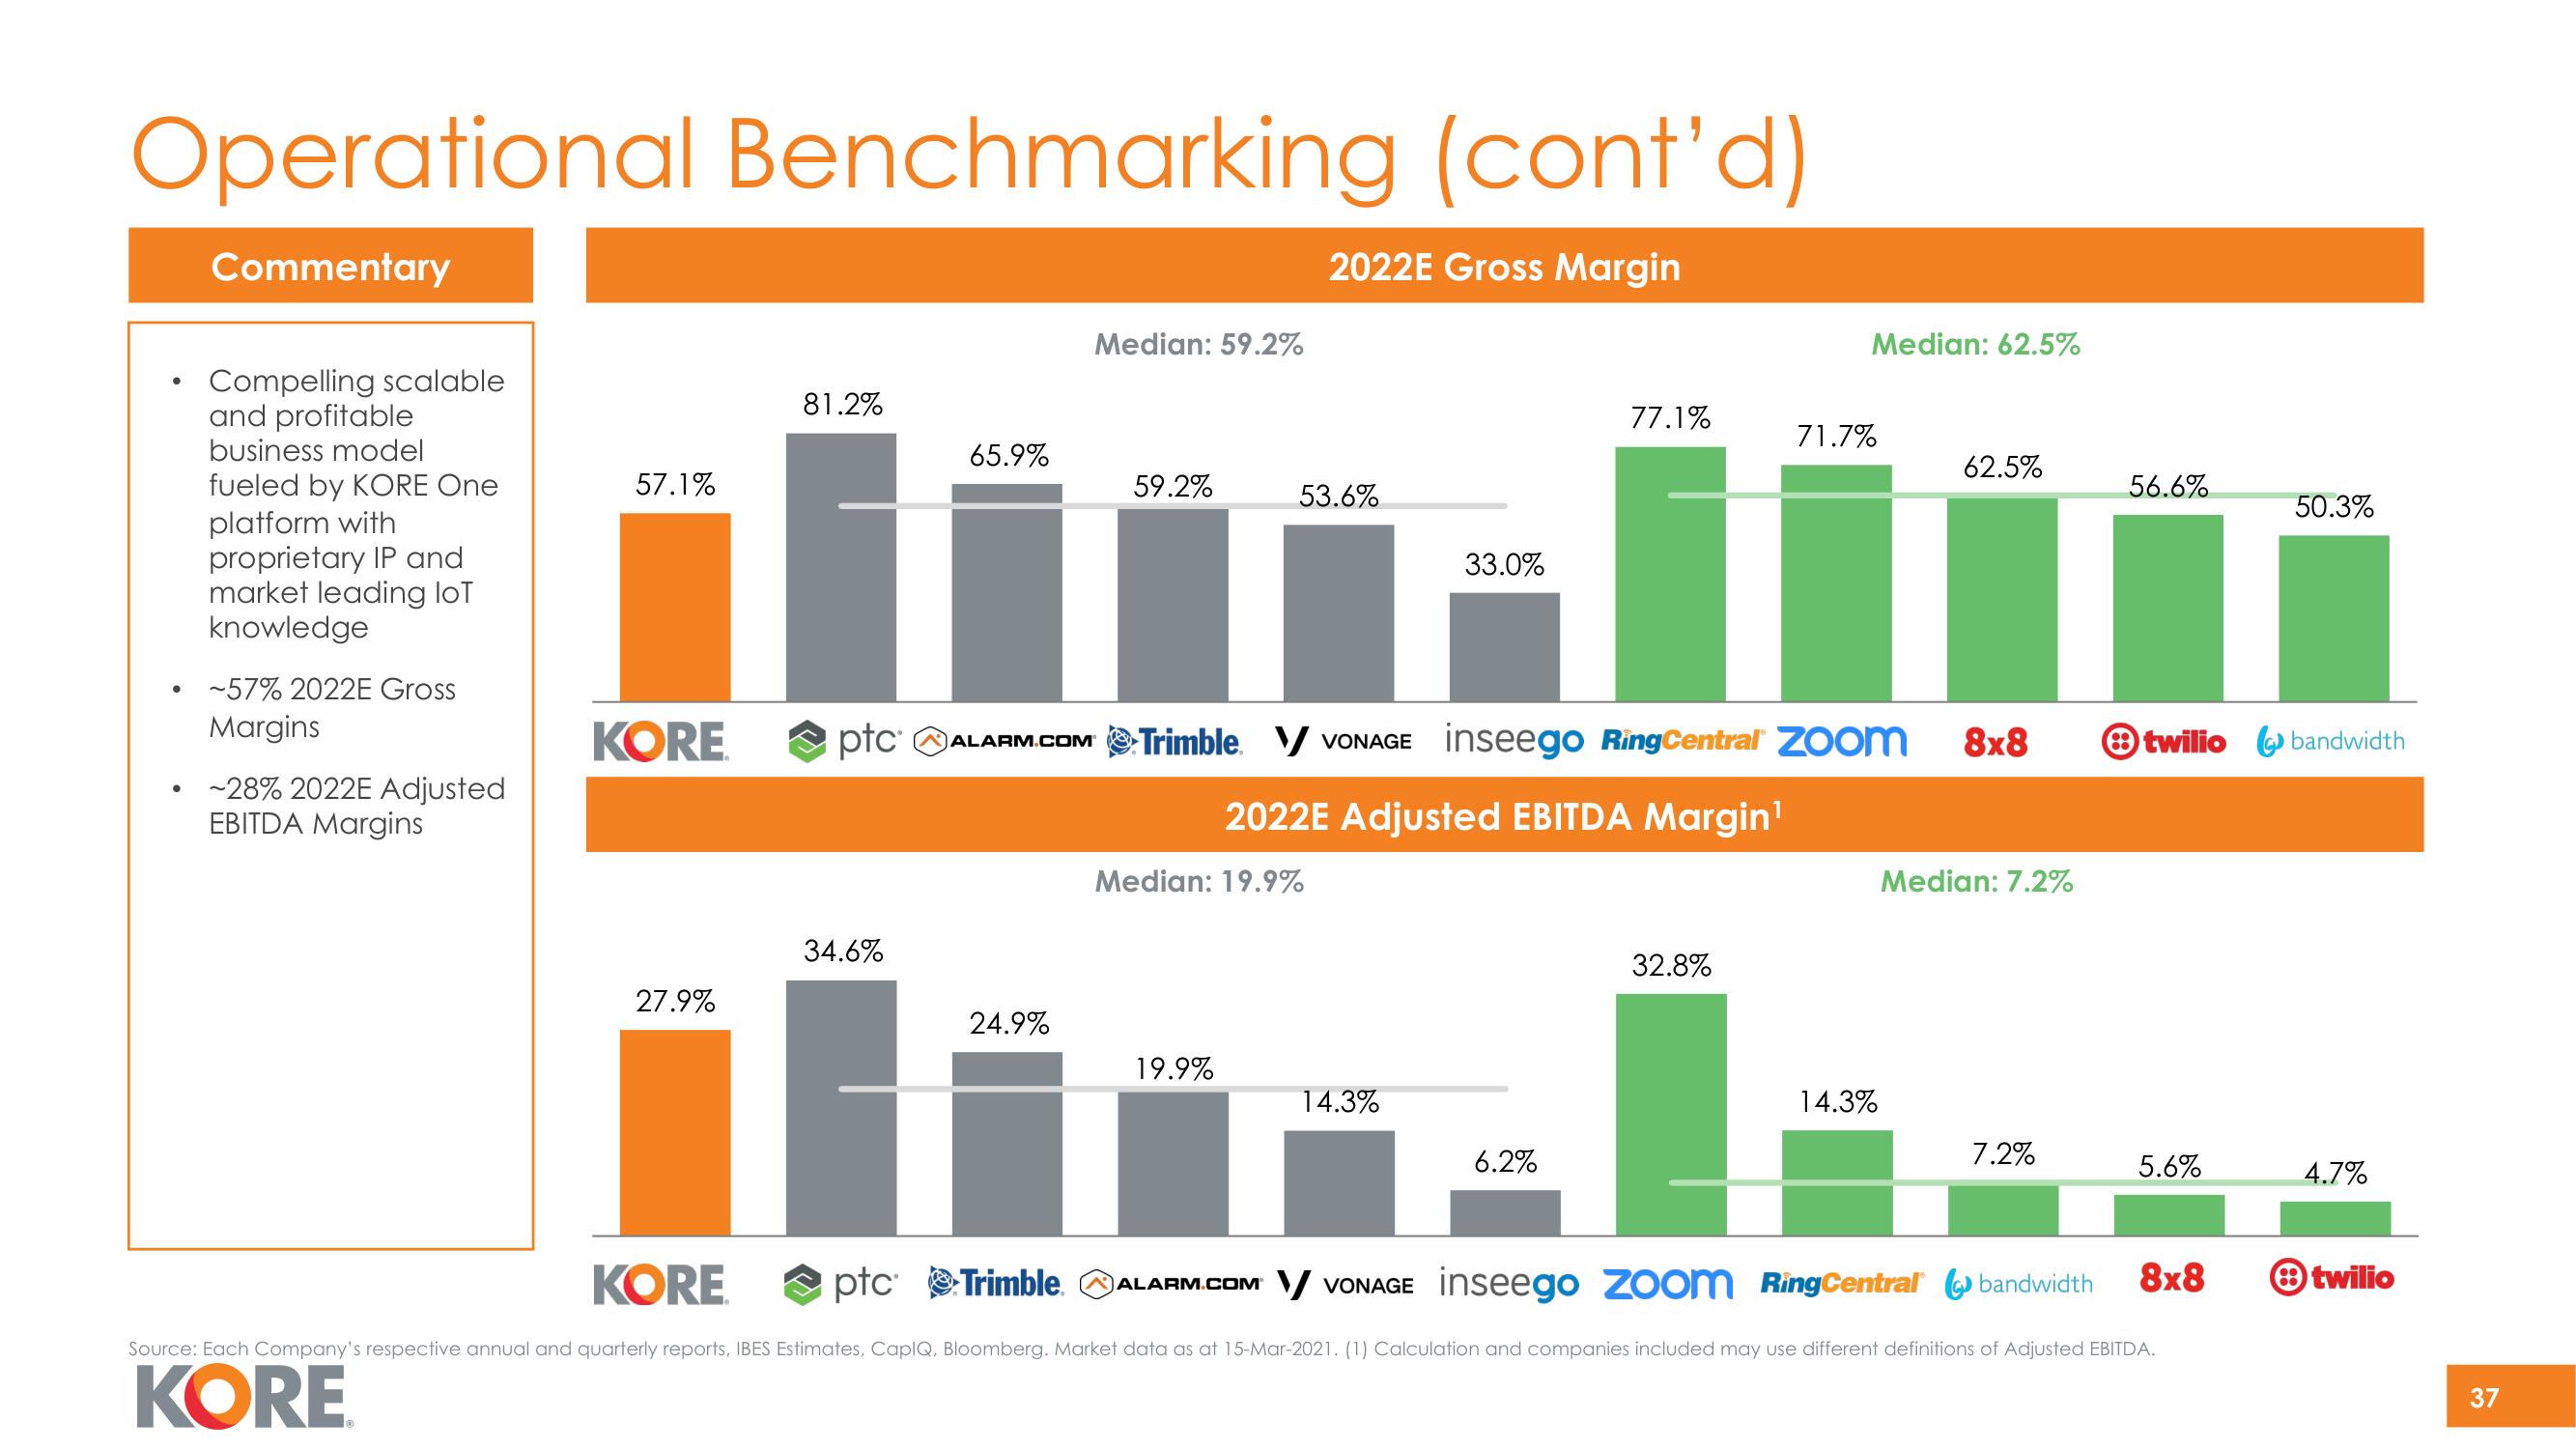
2022E Gross Margin
Commentary
Compelling scalable
and profitable
business model
fueled by KORE One
platform with
proprietary IP and
market leading loT
knowledge
~57% 2022E Gross
Margins
-28% 2022E Adjusted
EBITDA Margins
57.1%
KORE
27.9%
KORE
81.2%
I
ptc
34.6%
65.9%
ALARM.COM
24.9%
Median: 59.2%
59.2%
53.6%
Median: 19.9%
19.9%
33.0%
14.3%
77.1%
Trimble V VONAGE inseego Ring Central zoom 8x8
2022E Adjusted EBITDA Margin¹
6.2%
Median: 62.5%
32.8%
71.7%
62.5%
14.3%
Median: 7.2%
7.2%
56.6%
twilio
5.6%
ptc Trimble. ALARM.COM V VONAGE inseego Zoom RingCentral bandwidth 8x8
Source: Each Company's respective annual and quarterly reports, IBES Estimates, CapIQ, Bloomberg. Market data as at 15-Mar-2021. (1) Calculation and companies included may use different definitions of Adjusted EBITDA.
KORE
50.3%
bandwidth
4.7%
twilio
37View entire presentation