HHR Investor Presentation Deck
1
2
3
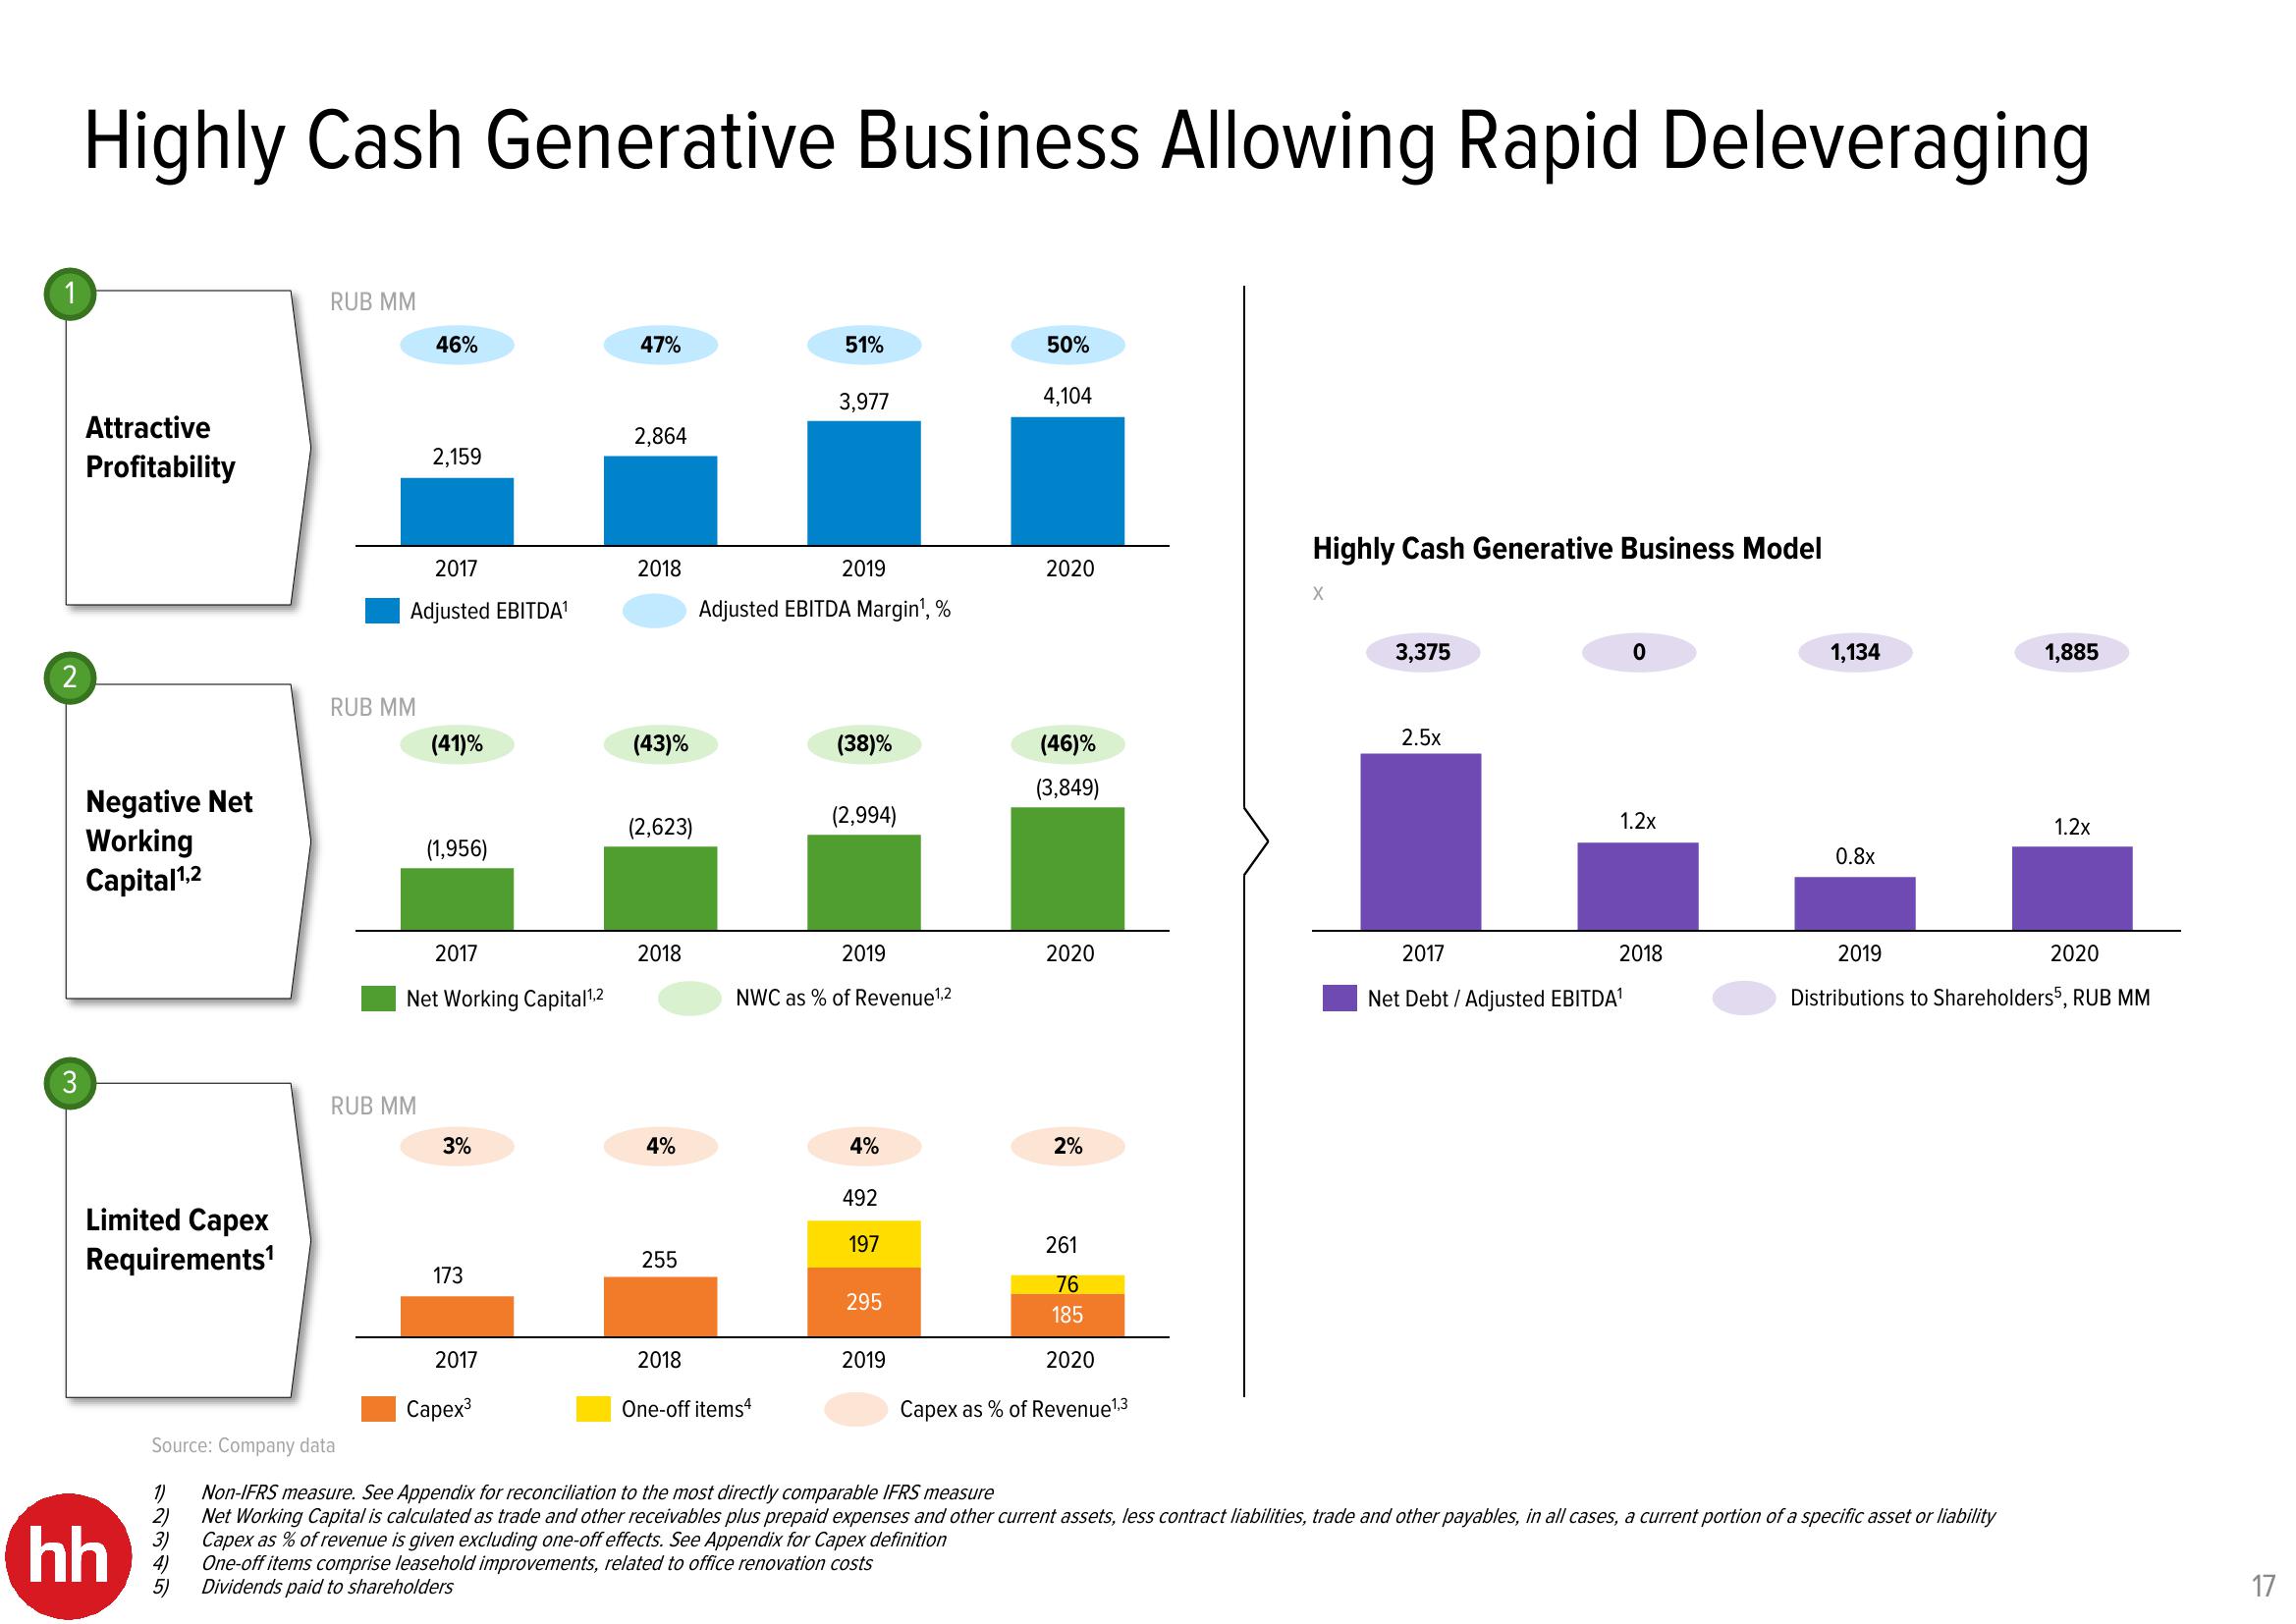
Highly Cash Generative Business Allowing Rapid Deleveraging
Attractive
Profitability
Negative Net
Working
Capital ¹,2
Limited Capex
Requirements¹
hh
12345
3)
RUB MM
5)
RUB MM
46%
2017
Adjusted EBITDA¹
2,159
RUB MM
(41)%
(1,956)
2017
Net Working Capital¹,2
3%
173
2017
Capex3
47%
2,864
2018
(43)%
(2,623)
2018
4%
255
51%
3,977
2019
Adjusted EBITDA Margin¹, %
2018
One-off items4
(38)%
(2,994)
2019
NWC as % of Revenue¹,2
4%
492
197
295
2019
4) One-off items comprise leasehold improvements, related to office renovation costs
Dividends paid to shareholders
50%
4,104
2020
(46)%
(3,849)
2020
2%
261
76
185
2020
Capex as % of Revenue ¹,3
Highly Cash Generative Business Model
X
3,375
2.5x
0
1.2x
2017
Net Debt / Adjusted EBITDA¹
2018
Source: Company data
Non-IFRS measure. See Appendix for reconciliation to the most directly comparable IFRS measure
2) Net Working Capital is calculated as trade and other receivables plus prepaid expenses and other current assets, less contract liabilities, trade and other payables, in all cases, a current portion of a specific asset or liability
Capex as % of revenue is given excluding one-off effects. See Appendix for Capex definition
1,134
0.8x
1,885
1.2x
2019
2020
Distributions to Shareholders5, RUB MM
17View entire presentation