Experian ESG Presentation Deck
Executive Summary
Improving Financial Health
Employees - Gender diversity
Gender diversity by level
Senior leaders
Total population of senior leaders (men & women)
Mid-level leaders
Total workforce
Data
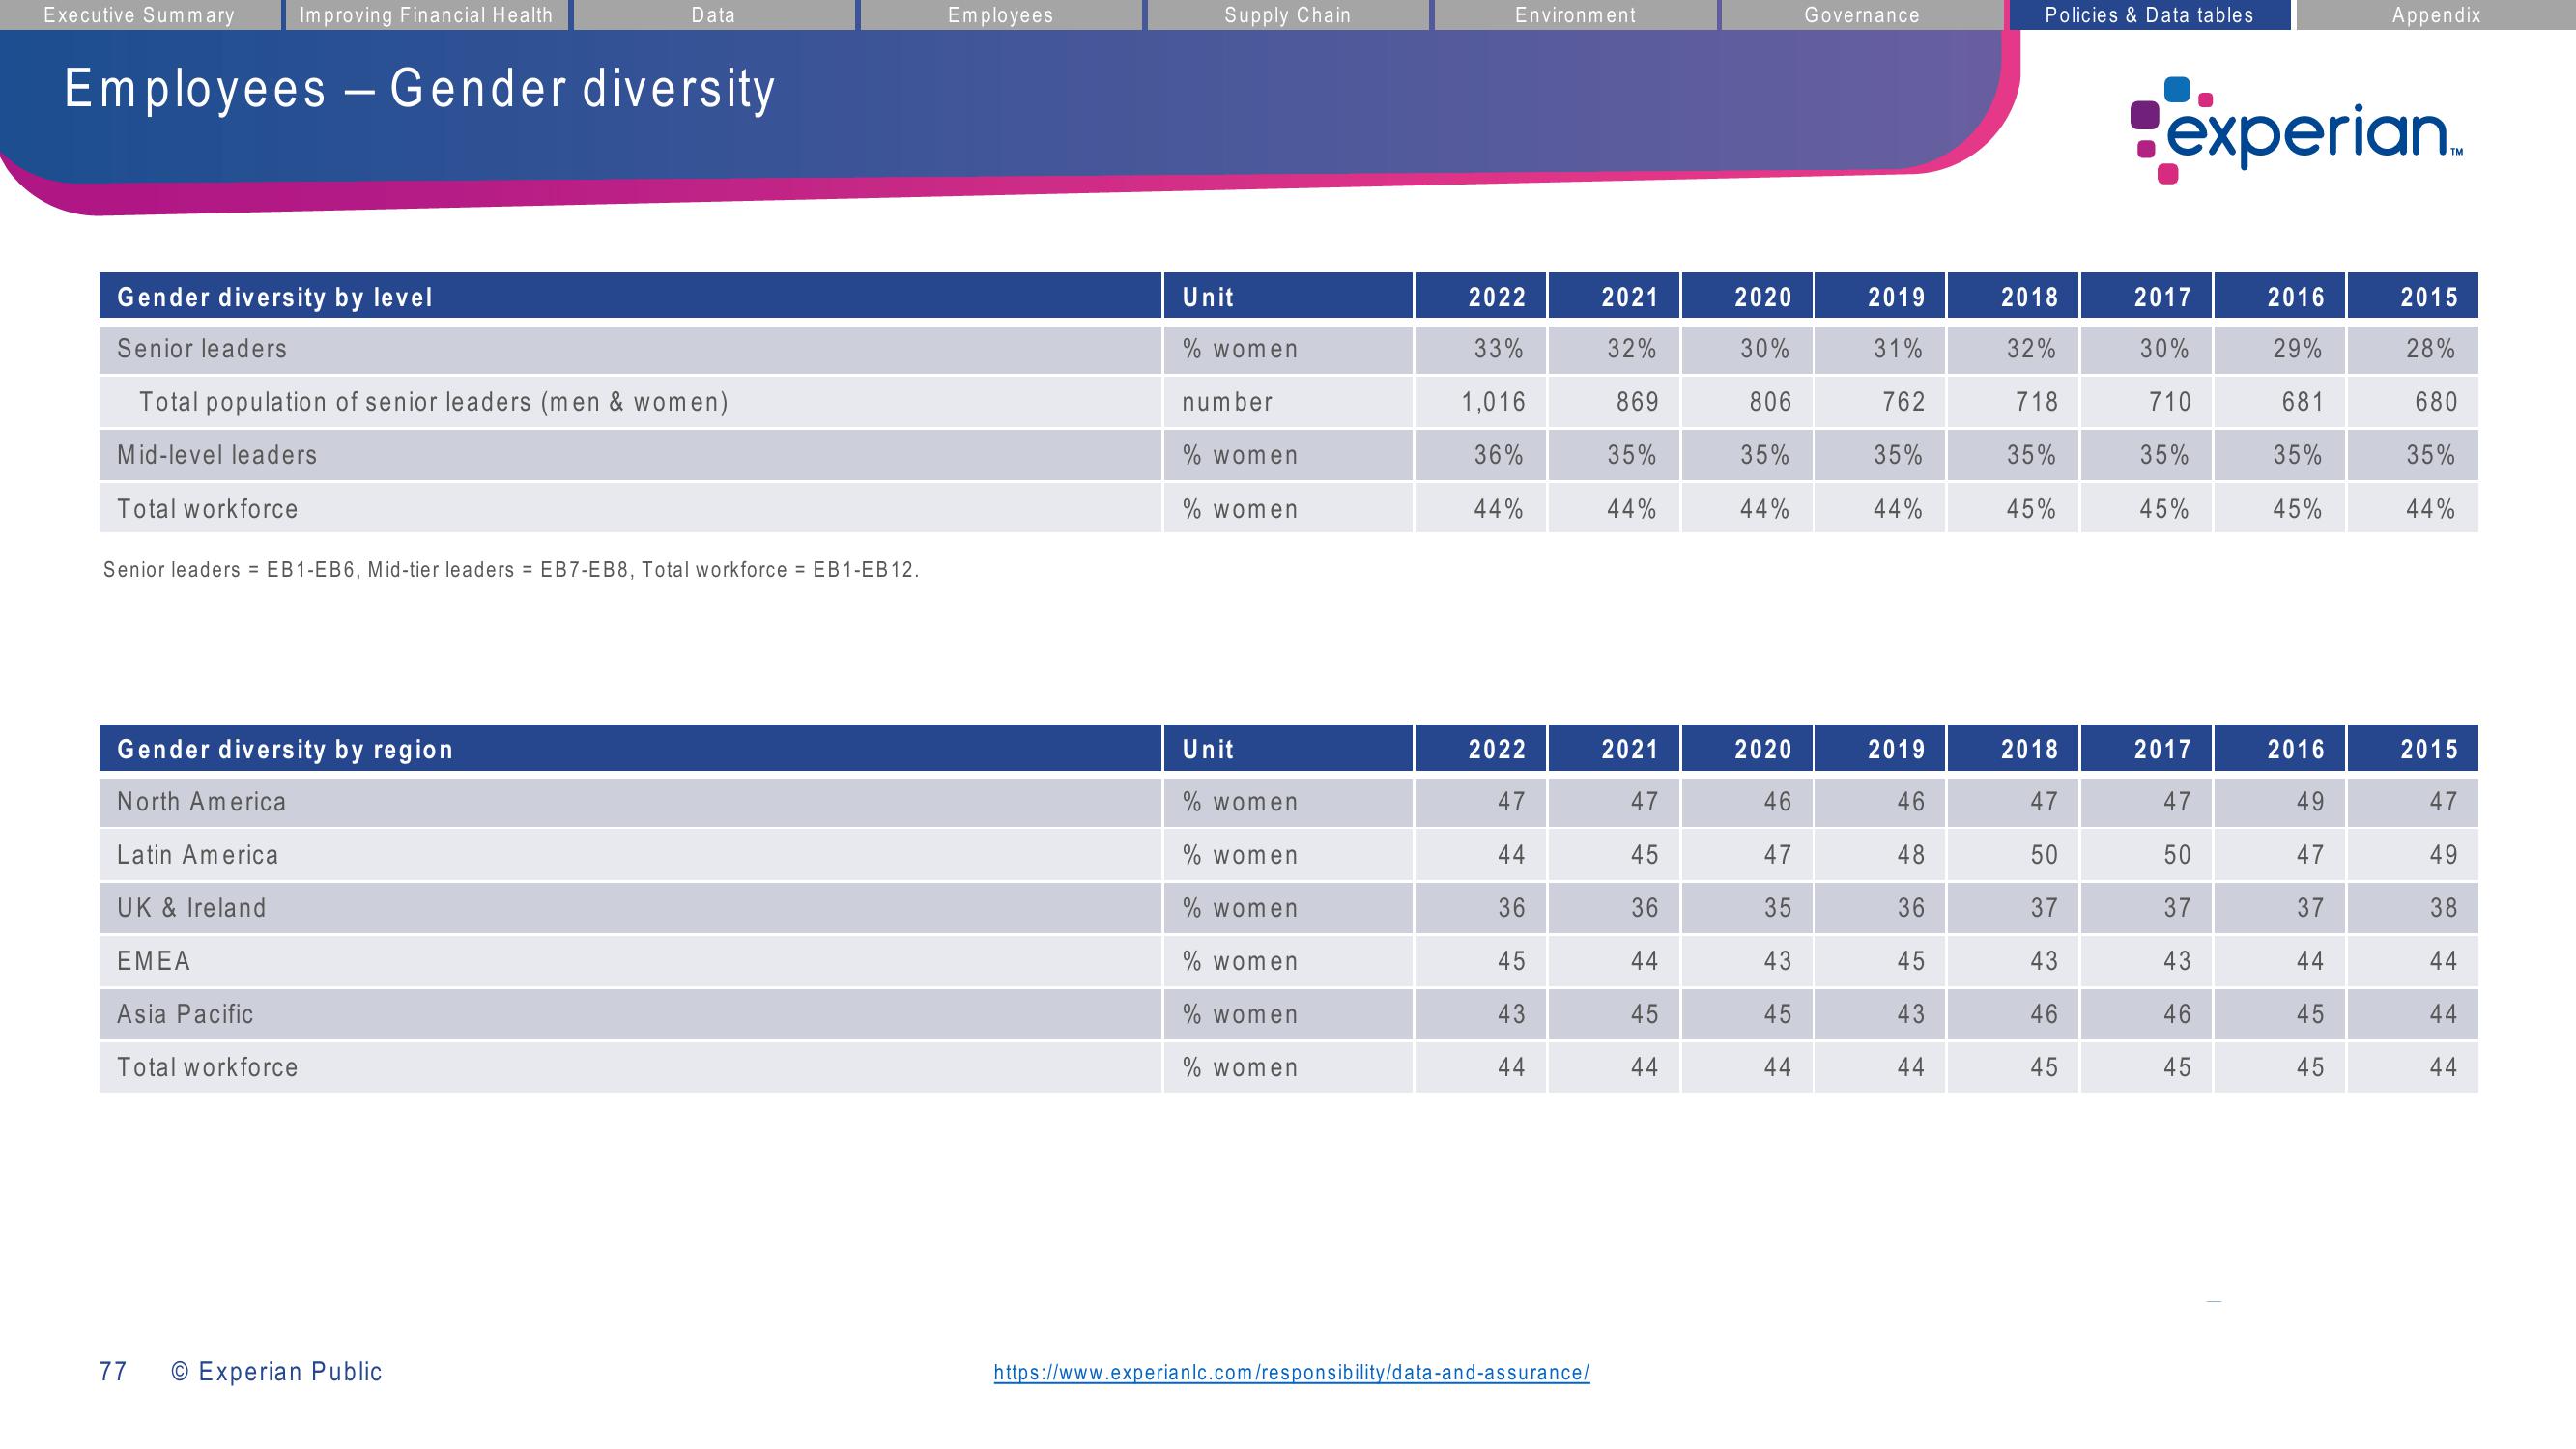
Senior leaders = EB1-EB6, Mid-tier leaders = EB7-EB8, Total workforce = EB1-EB12.
Gender diversity by region
North America
Latin America
UK & Ireland
ΕΜΕΑ
Asia Pacific
Total workforce
77
O Experian Public
Employees
Supply Chain
Unit
% women
number
% women
% women
Unit
% women
% women
% women
% women
% women
% women
Environment
2022
33%
1,016
36%
44%
2022
47
44
36
45
43
44
https://www.experianlc.com/responsibility/data-and-assurance/
2021
32%
869
35%
44%
2021
47
45
36
44
45
44
2020
30%
806
35%
44%
2020
46
47
35
43
45
44
Governance
2019
31%
762
35%
44%
2019
46
48
36
45
43
44
Policies & Data tables
2018
32%
718
35%
45%
2018
47
50
37
43
46
45
experian.
2017
30%
710
35%
45%
2017
47
50
37
43
46
45
2016
29%
681
35%
45%
Appendix
2016
49
47
37
44
45
45
2015
28%
680
35%
44%
2015
47
49
38
44
44
44View entire presentation