OppFi Results Presentation Deck
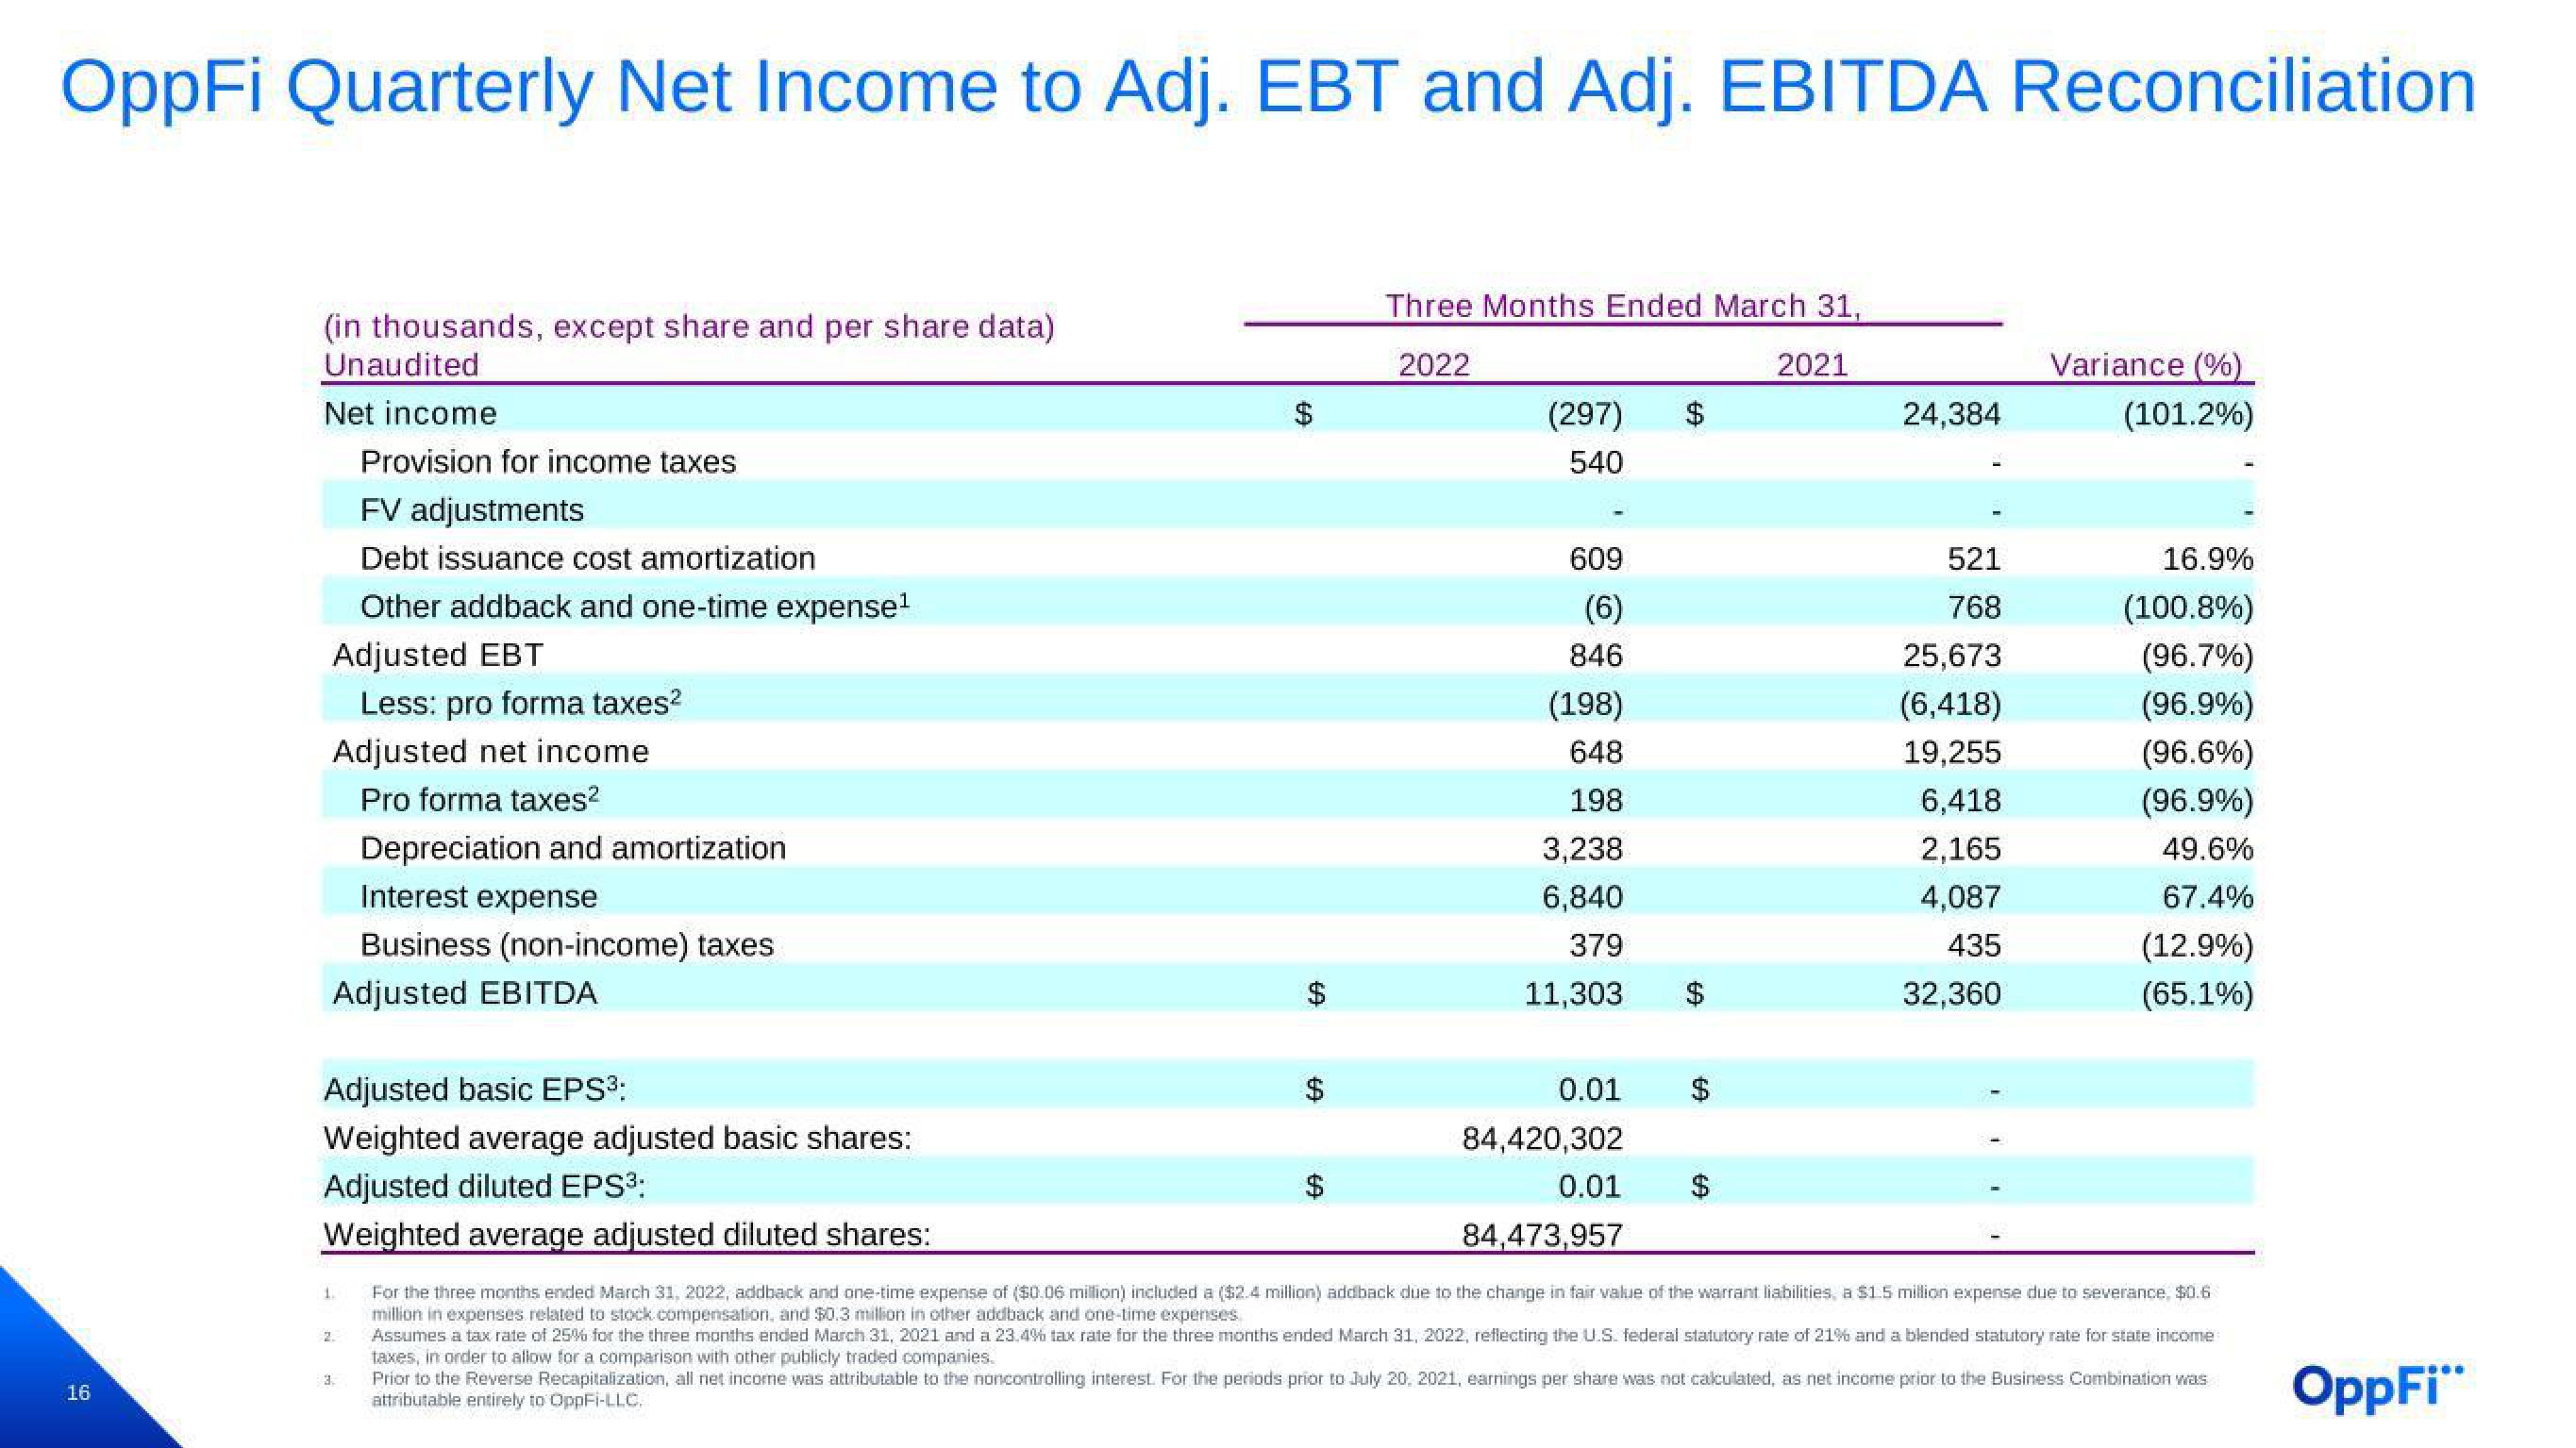
OppFi Quarterly Net Income to Adj. EBT and Adj. EBITDA Reconciliation
16
(in thousands, except share and per share data)
Unaudited
Net income
Provision for income taxes
FV adjustments
Debt issuance cost amortization
Other addback and one-time expense¹
Adjusted EBT
Less: pro forma taxes²
Adjusted net income
Pro forma taxes²
Depreciation and amortization
Interest expense
Business (non-income) taxes
Adjusted EBITDA
Adjusted basic EPS³:
Weighted average adjusted basic shares:
Adjusted diluted EPS³:
Weighted average adjusted diluted shares:
1.
2
$
69
GA
$
69
Three Months Ended March 31,
2022
2021
69
(297) $
540
609
(6)
846
(198)
648
198
3,238
6,840
379
11,303
0.01
$
$
24,384
$
521
768
25,673
(6,418)
19,255
6,418
2,165
4,087
435
32,360
Variance (%)
(101.2%)
84,420,302
0.01
84,473,957
For the three months ended March 31, 2022, addback and one-time expense of ($0.06 million) included a ($2.4 million) addback due to the change in fair value of the warrant liabilities, a $1.5 million expense due to severance, $0.6
million in expenses related to stock compensation, and $0.3 million in other addback and one-time expenses
Assumes a tax rate of 25% for the three months ended March 31, 2021 and a 23.4% tax rate for the three months ended March 31, 2022, reflecting the U.S. federal statutory rate of 21% and a blended statutory rate for state income
taxes, in order to allow for a comparison with other publicly traded companies.
Prior to the Reverse Recapitalization, all net income was attributable to the noncontrolling interest. For the periods prior to July 20, 2021, earnings per share was not calculated, as net income prior to the Business Combination was
attributable entirely to OppFi-LLC.
16.9%
(100.8%)
(96.7%)
(96.9%)
(96.6%)
(96.9%)
49.6%
67.4%
(12.9%)
(65.1%)
OppFi"View entire presentation