Maersk Results Presentation Deck
Maersk Group
- Interim Report 03 2015
MAERSK
DRILLING
Contents
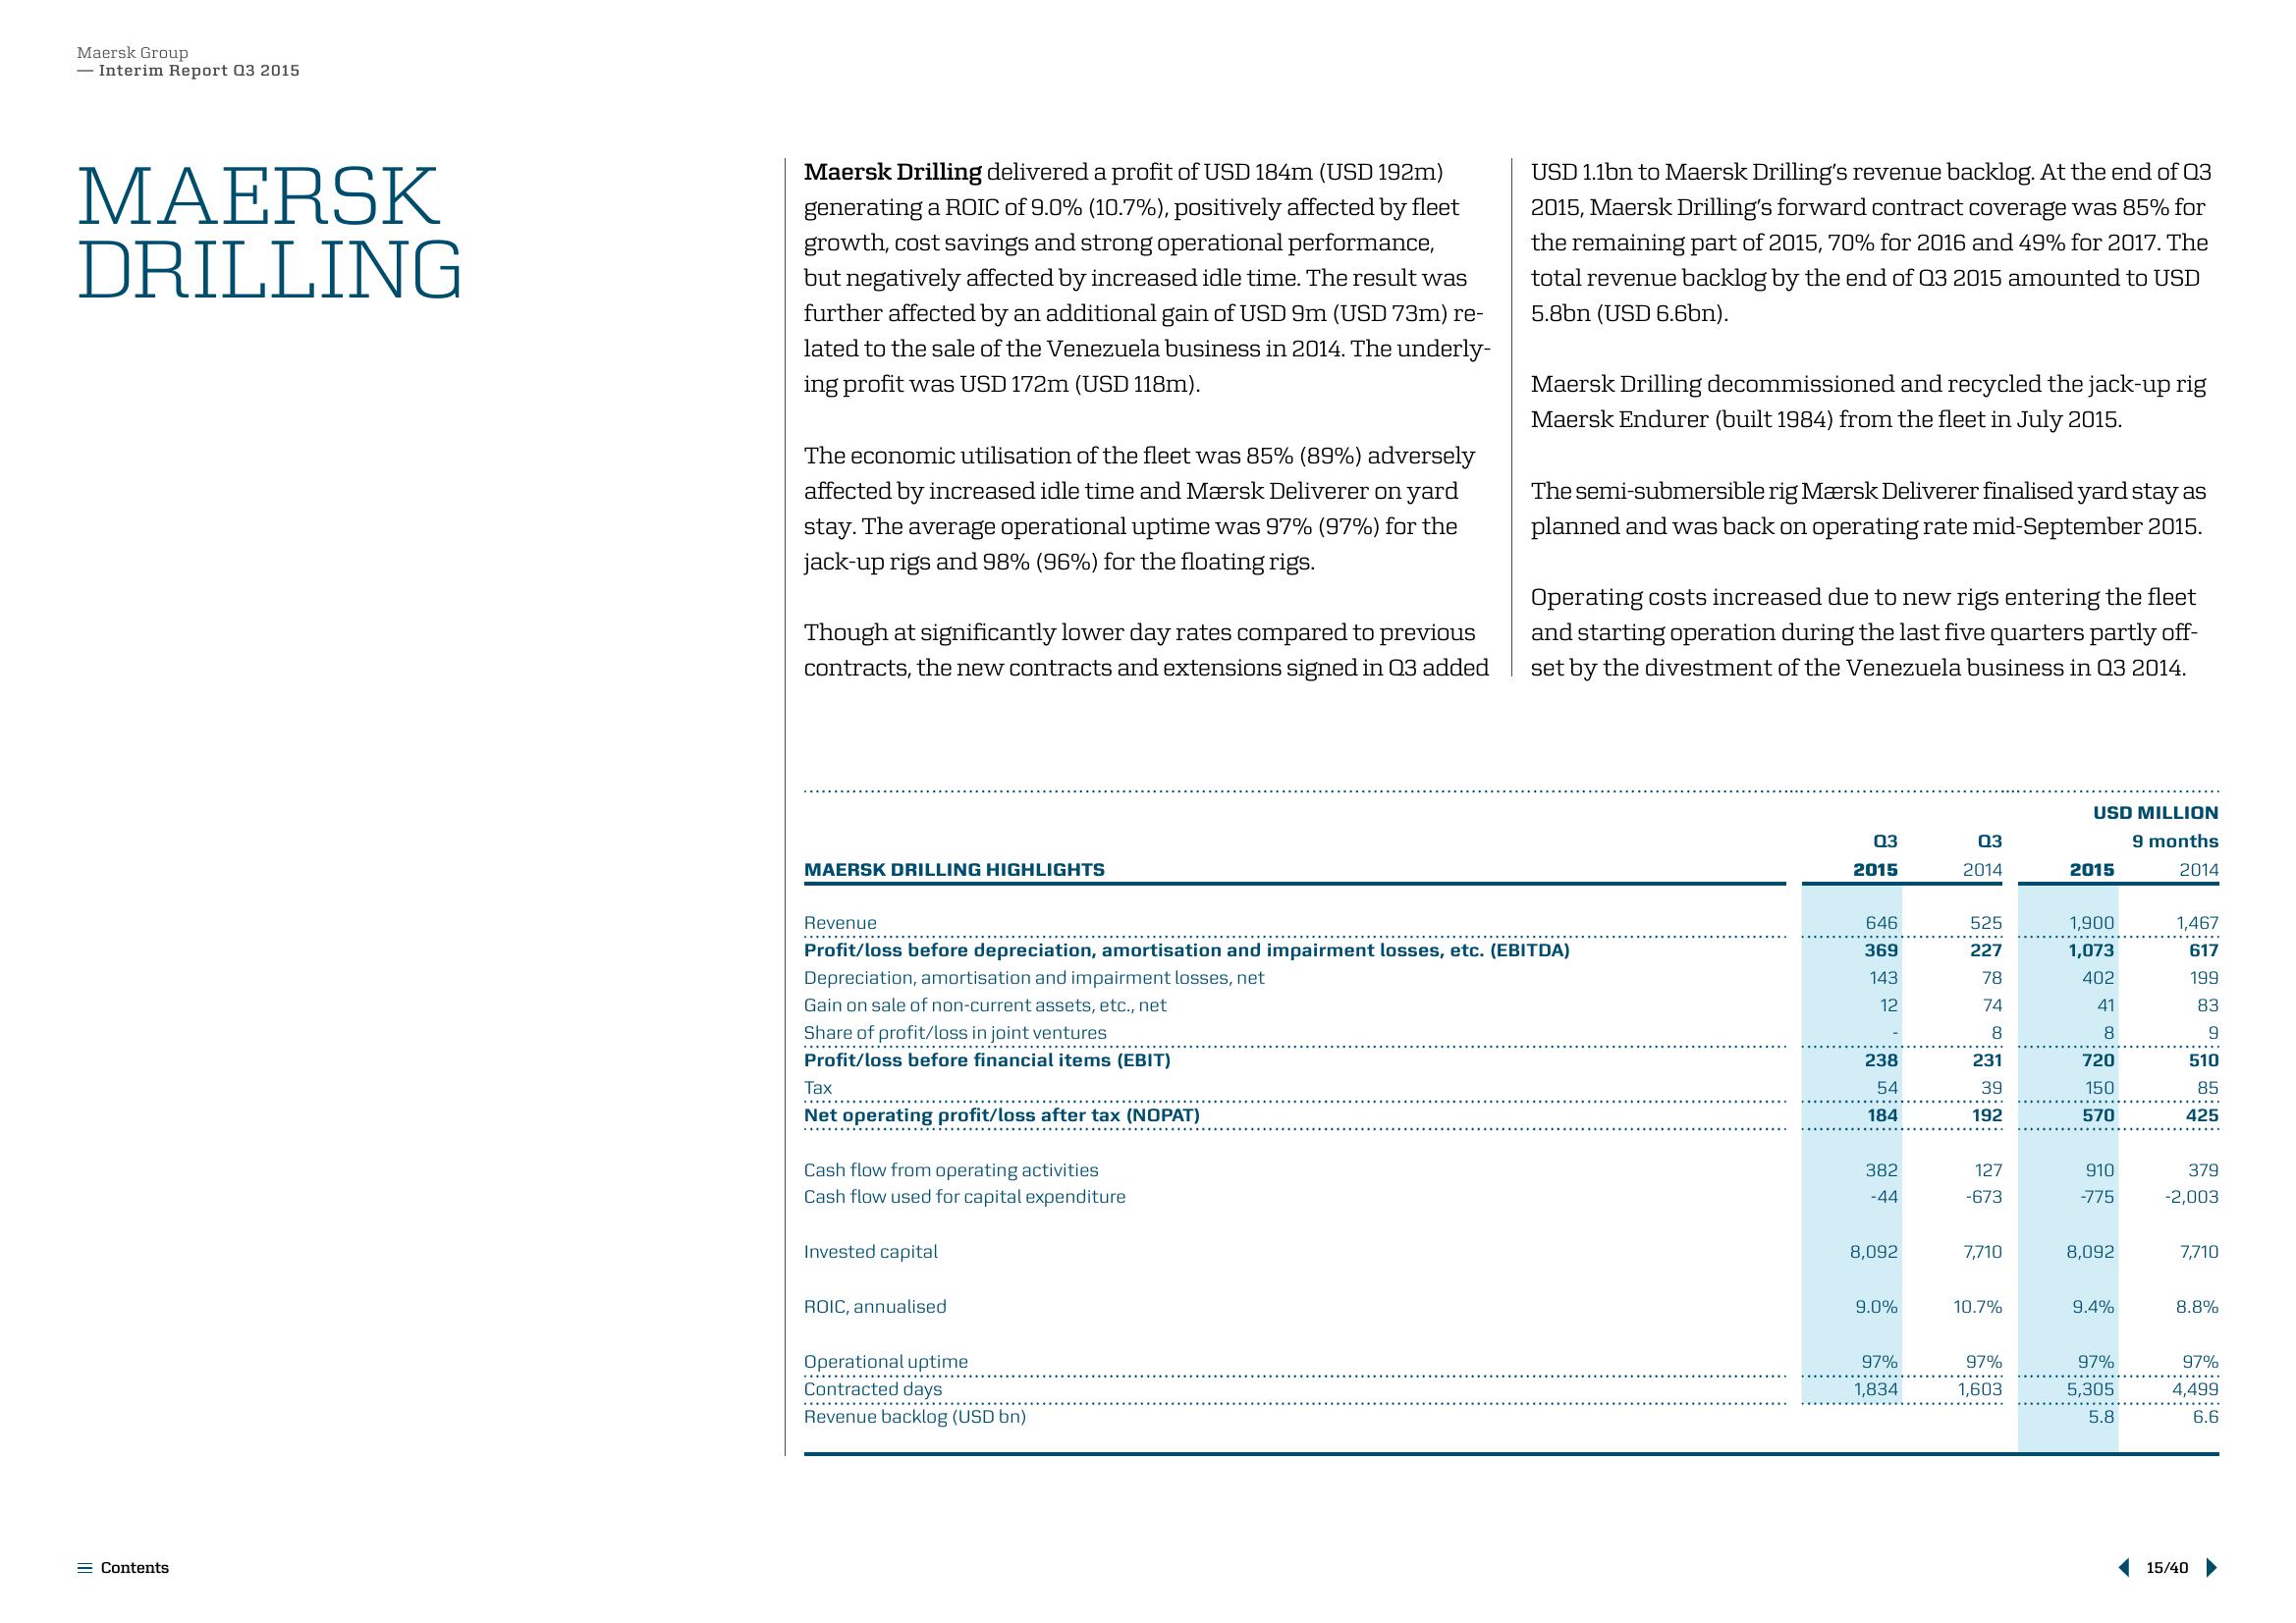
Maersk Drilling delivered a profit of USD 184m (USD 192m)
generating a ROIC of 9.0% (10.7%), positively affected by fleet
growth, cost savings and strong operational performance,
but negatively affected by increased idle time. The result was
further affected by an additional gain of USD 9m (USD 73m) re-
lated to the sale of the Venezuela business in 2014. The underly-
ing profit was USD 172m (USD 118m).
The economic utilisation of the fleet was 85% (89%) adversely
affected by increased idle time and Mærsk Deliverer on yard
stay. The average operational uptime was 97% (97%) for the
jack-up rigs and 98% (96%) for the floating rigs.
Though at significantly lower day rates compared to previous
contracts, the new contracts and extensions signed in Q3 added
MAERSK DRILLING HIGHLIGHTS
Revenue
**********.
Tax
Net operating profit/loss after tax (NOPAT)
Cash flow from operating activities
Cash flow used for capital expenditure
Invested capital
Profit/loss before depreciation, amortisation and impairment losses, etc. (EBITDA)
Depreciation, amortisation and impairment losses, net
Gain on sale of non-current assets, etc., net
Share of profit/loss in joint ventures
Profit/loss before financial items (EBIT)
ROIC, annualised
USD 1.1bn to Maersk Drilling's revenue backlog. At the end of Q3
2015, Maersk Drilling's forward contract coverage was 85% for
the remaining part of 2015, 70% for 2016 and 49% for 2017. The
total revenue backlog by the end of Q3 2015 amounted to USD
5.8bn (USD 6.6bn).
Operational uptime
....…....
Contracted days
Revenue backlog (USD bn)
Maersk Drilling decommissioned and recycled the jack-up rig
Maersk Endurer (built 1984) from the fleet in July 2015.
The semi-submersible rig Mærsk Deliverer finalised yard stay as
planned and was back on operating rate mid-September 2015.
Operating costs increased due to new rigs entering the fleet
and starting operation during the last five quarters partly off-
set by the divestment of the Venezuela business in Q3 2014.
03
2015
646
369
143
12
238
54
184
382
-44
8,092
9.0%
97%
1,834
03
2014
525
227
78
74
8
231
39
192
127
-673
7,710
10.7%
97%
1,603
USD MILLION
9 months
2014
2015
1,900
1,073
402
41
8
720
150
570
910
-775
8,092
9.4%
97%
5,305
5.8
1,467
617
199
83
9
510
85
425
379
-2,003
7,710
8.8%
97%
4,499
6.6
15/40View entire presentation