Bakkt Results Presentation Deck
3Q23 Condensed balance sheet
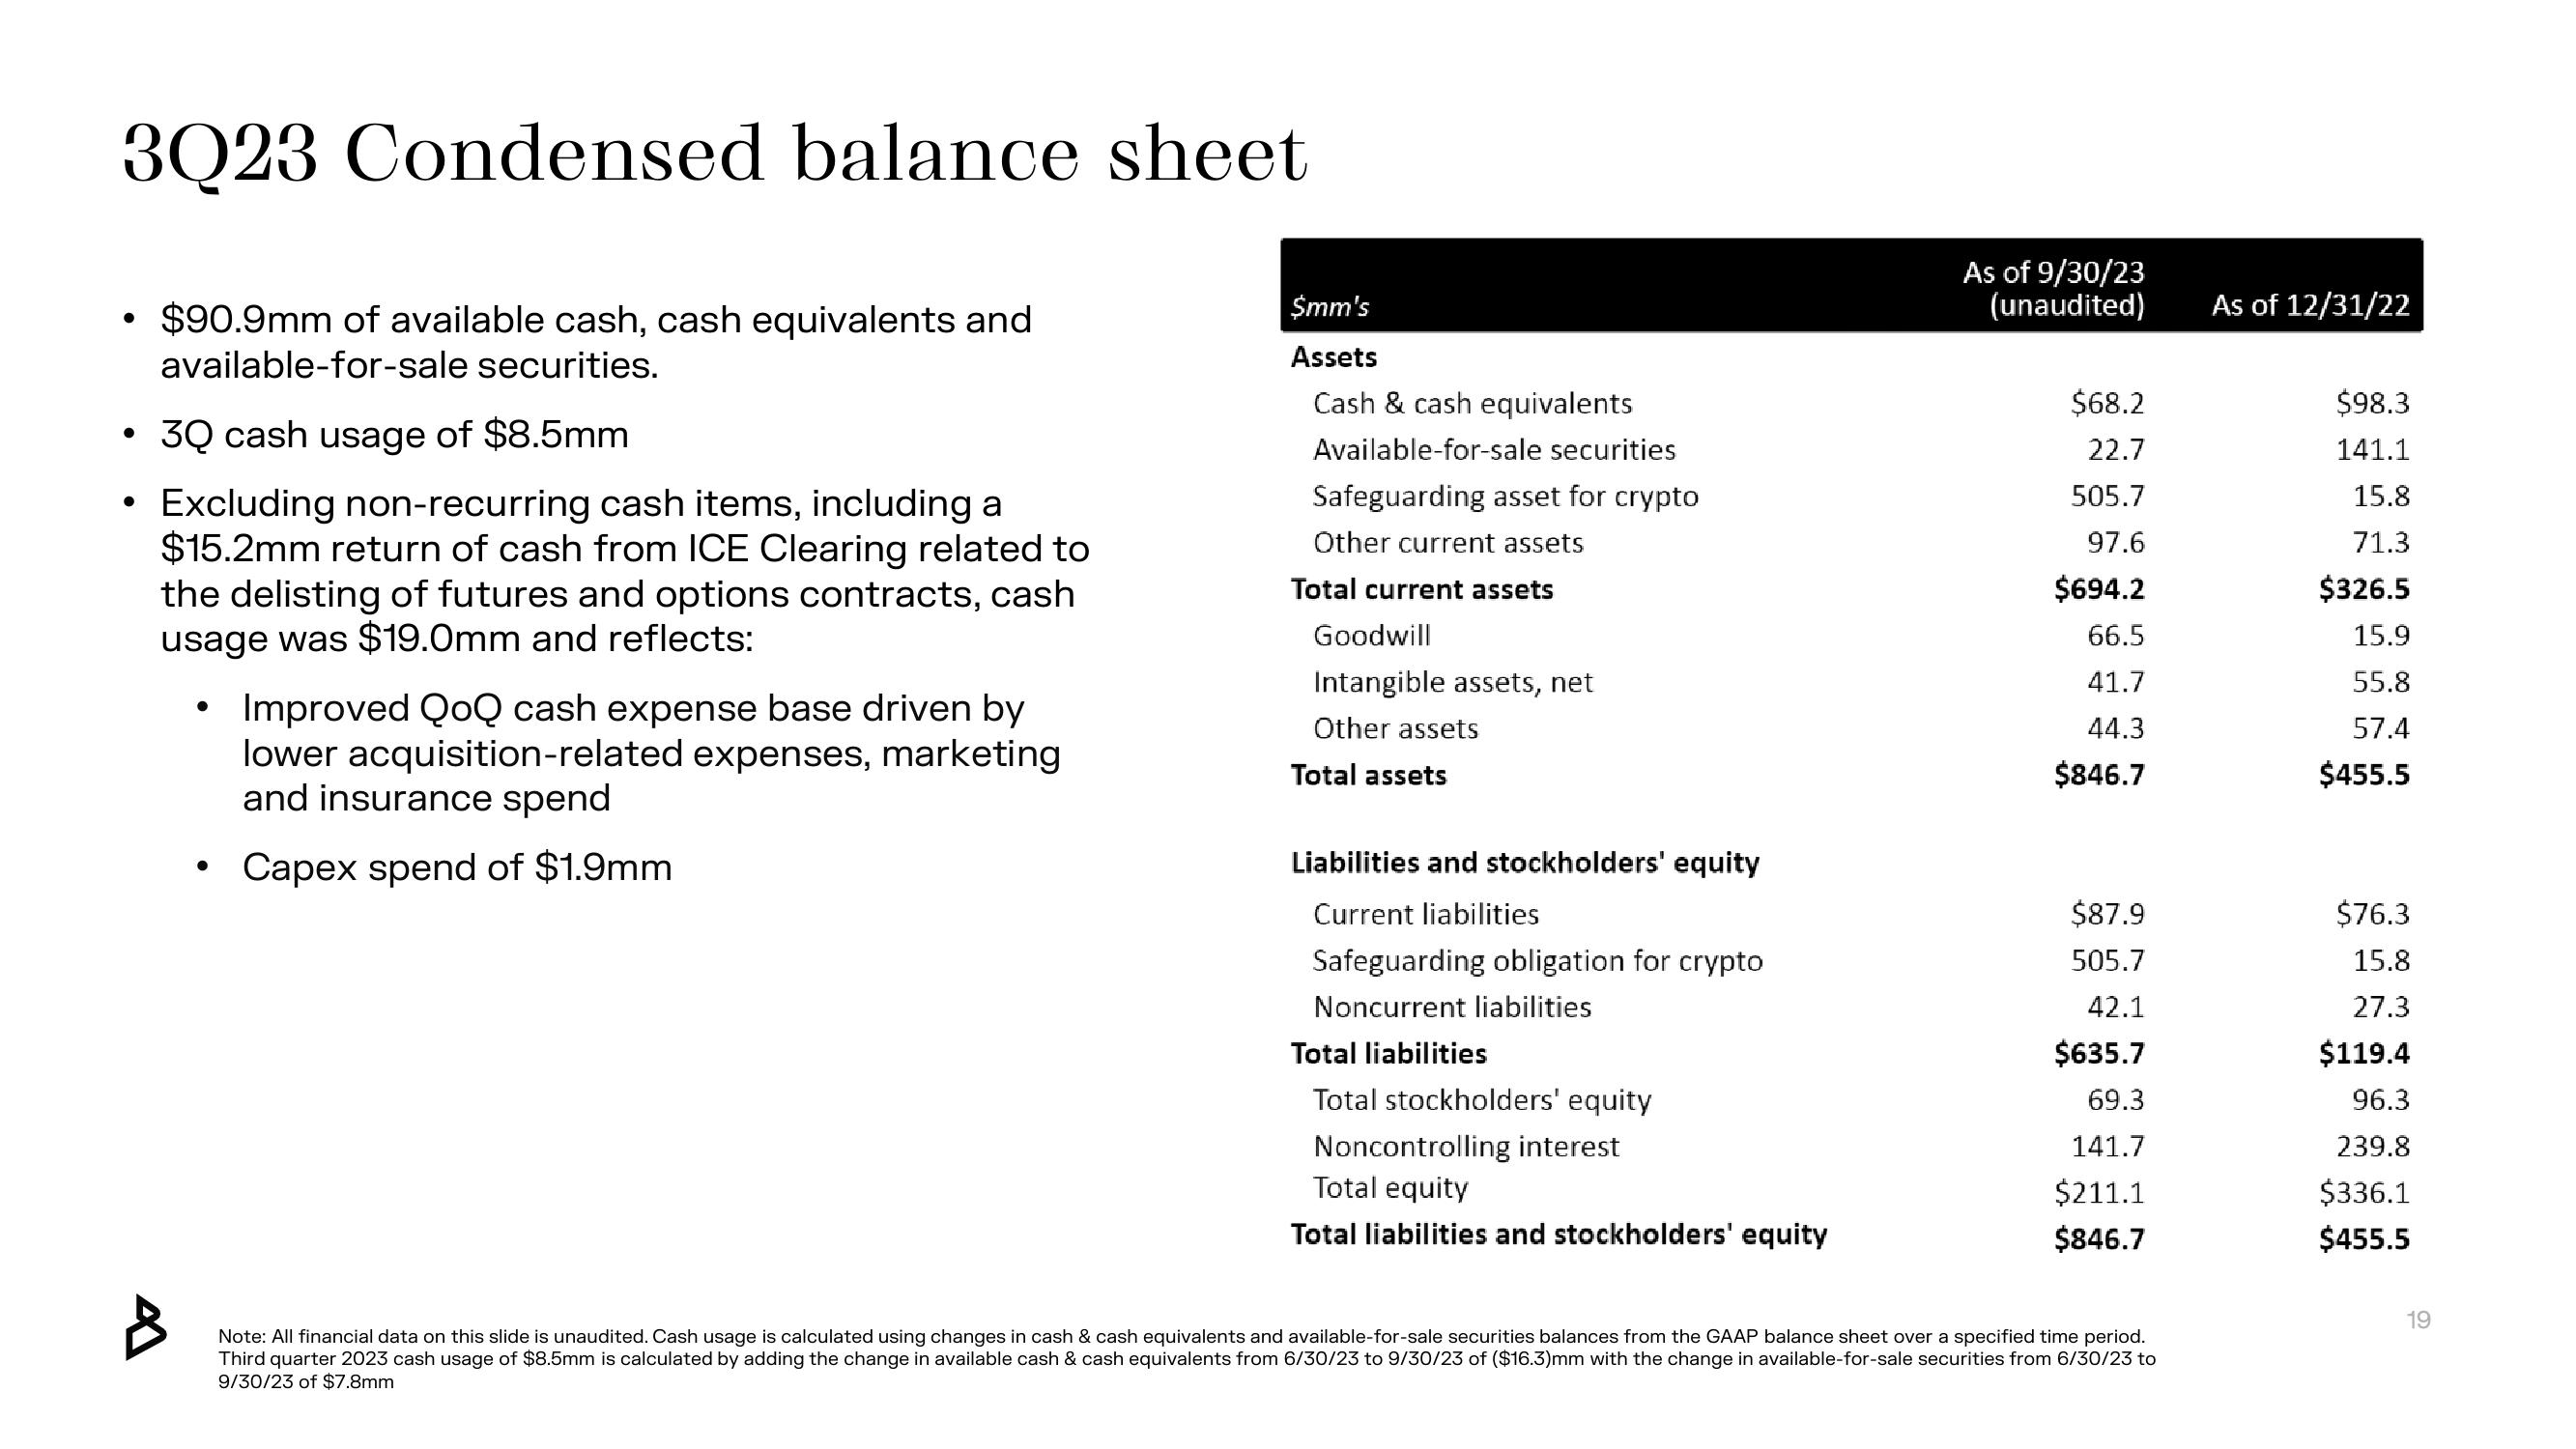
$90.9mm of available cash, cash equivalents and
available-for-sale securities.
3Q cash usage of $8.5mm
Excluding non-recurring cash items, including a
$15.2mm return of cash from ICE Clearing related to
the delisting of futures and options contracts, cash
usage was $19.0mm and reflects:
●
●
Improved QoQ cash expense base driven by
lower acquisition-related expenses, marketing
and insurance spend
Capex spend of $1.9mm
$mm's
Assets
Cash & cash equivalents
Available-for-sale securities
Safeguarding asset for crypto
Other current assets
Total current assets
Goodwill
Intangible assets, net
Other assets
Total assets
Liabilities and stockholders' equity
Current liabilities
Safeguarding obligation for crypto
Noncurrent liabilities
Total liabilities
Total stockholders' equity
Noncontrolling interest
Total equity
Total liabilities and stockholders' equity
As of 9/30/23
(unaudited)
$68.2
22.7
505.7
97.6
$694.2
66.5
41.7
44.3
$846.7
$87.9
505.7
42.1
$635.7
69.3
141.7
$211.1
$846.7
Note: All financial data on this slide is unaudited. Cash usage is calculated using changes in cash & cash equivalents and available-for-sale securities balances from the GAAP balance sheet over a specified time period.
Third quarter 2023 cash usage of $8.5mm is calculated by adding the change in available cash & cash equivalents from 6/30/23 to 9/30/23 of ($16.3)mm with the change in available-for-sale securities from 6/30/23 to
9/30/23 of $7.8mm
As of 12/31/22
$98.3
141.1
15.8
71.3
$326.5
15.9
55.8
57.4
$455.5
$76.3
15.8
27.3
$119.4
96.3
239.8
$336.1
$455.5
19View entire presentation