Enfusion Results Presentation Deck
Reconciliations of Non-GAAP Financial Measures
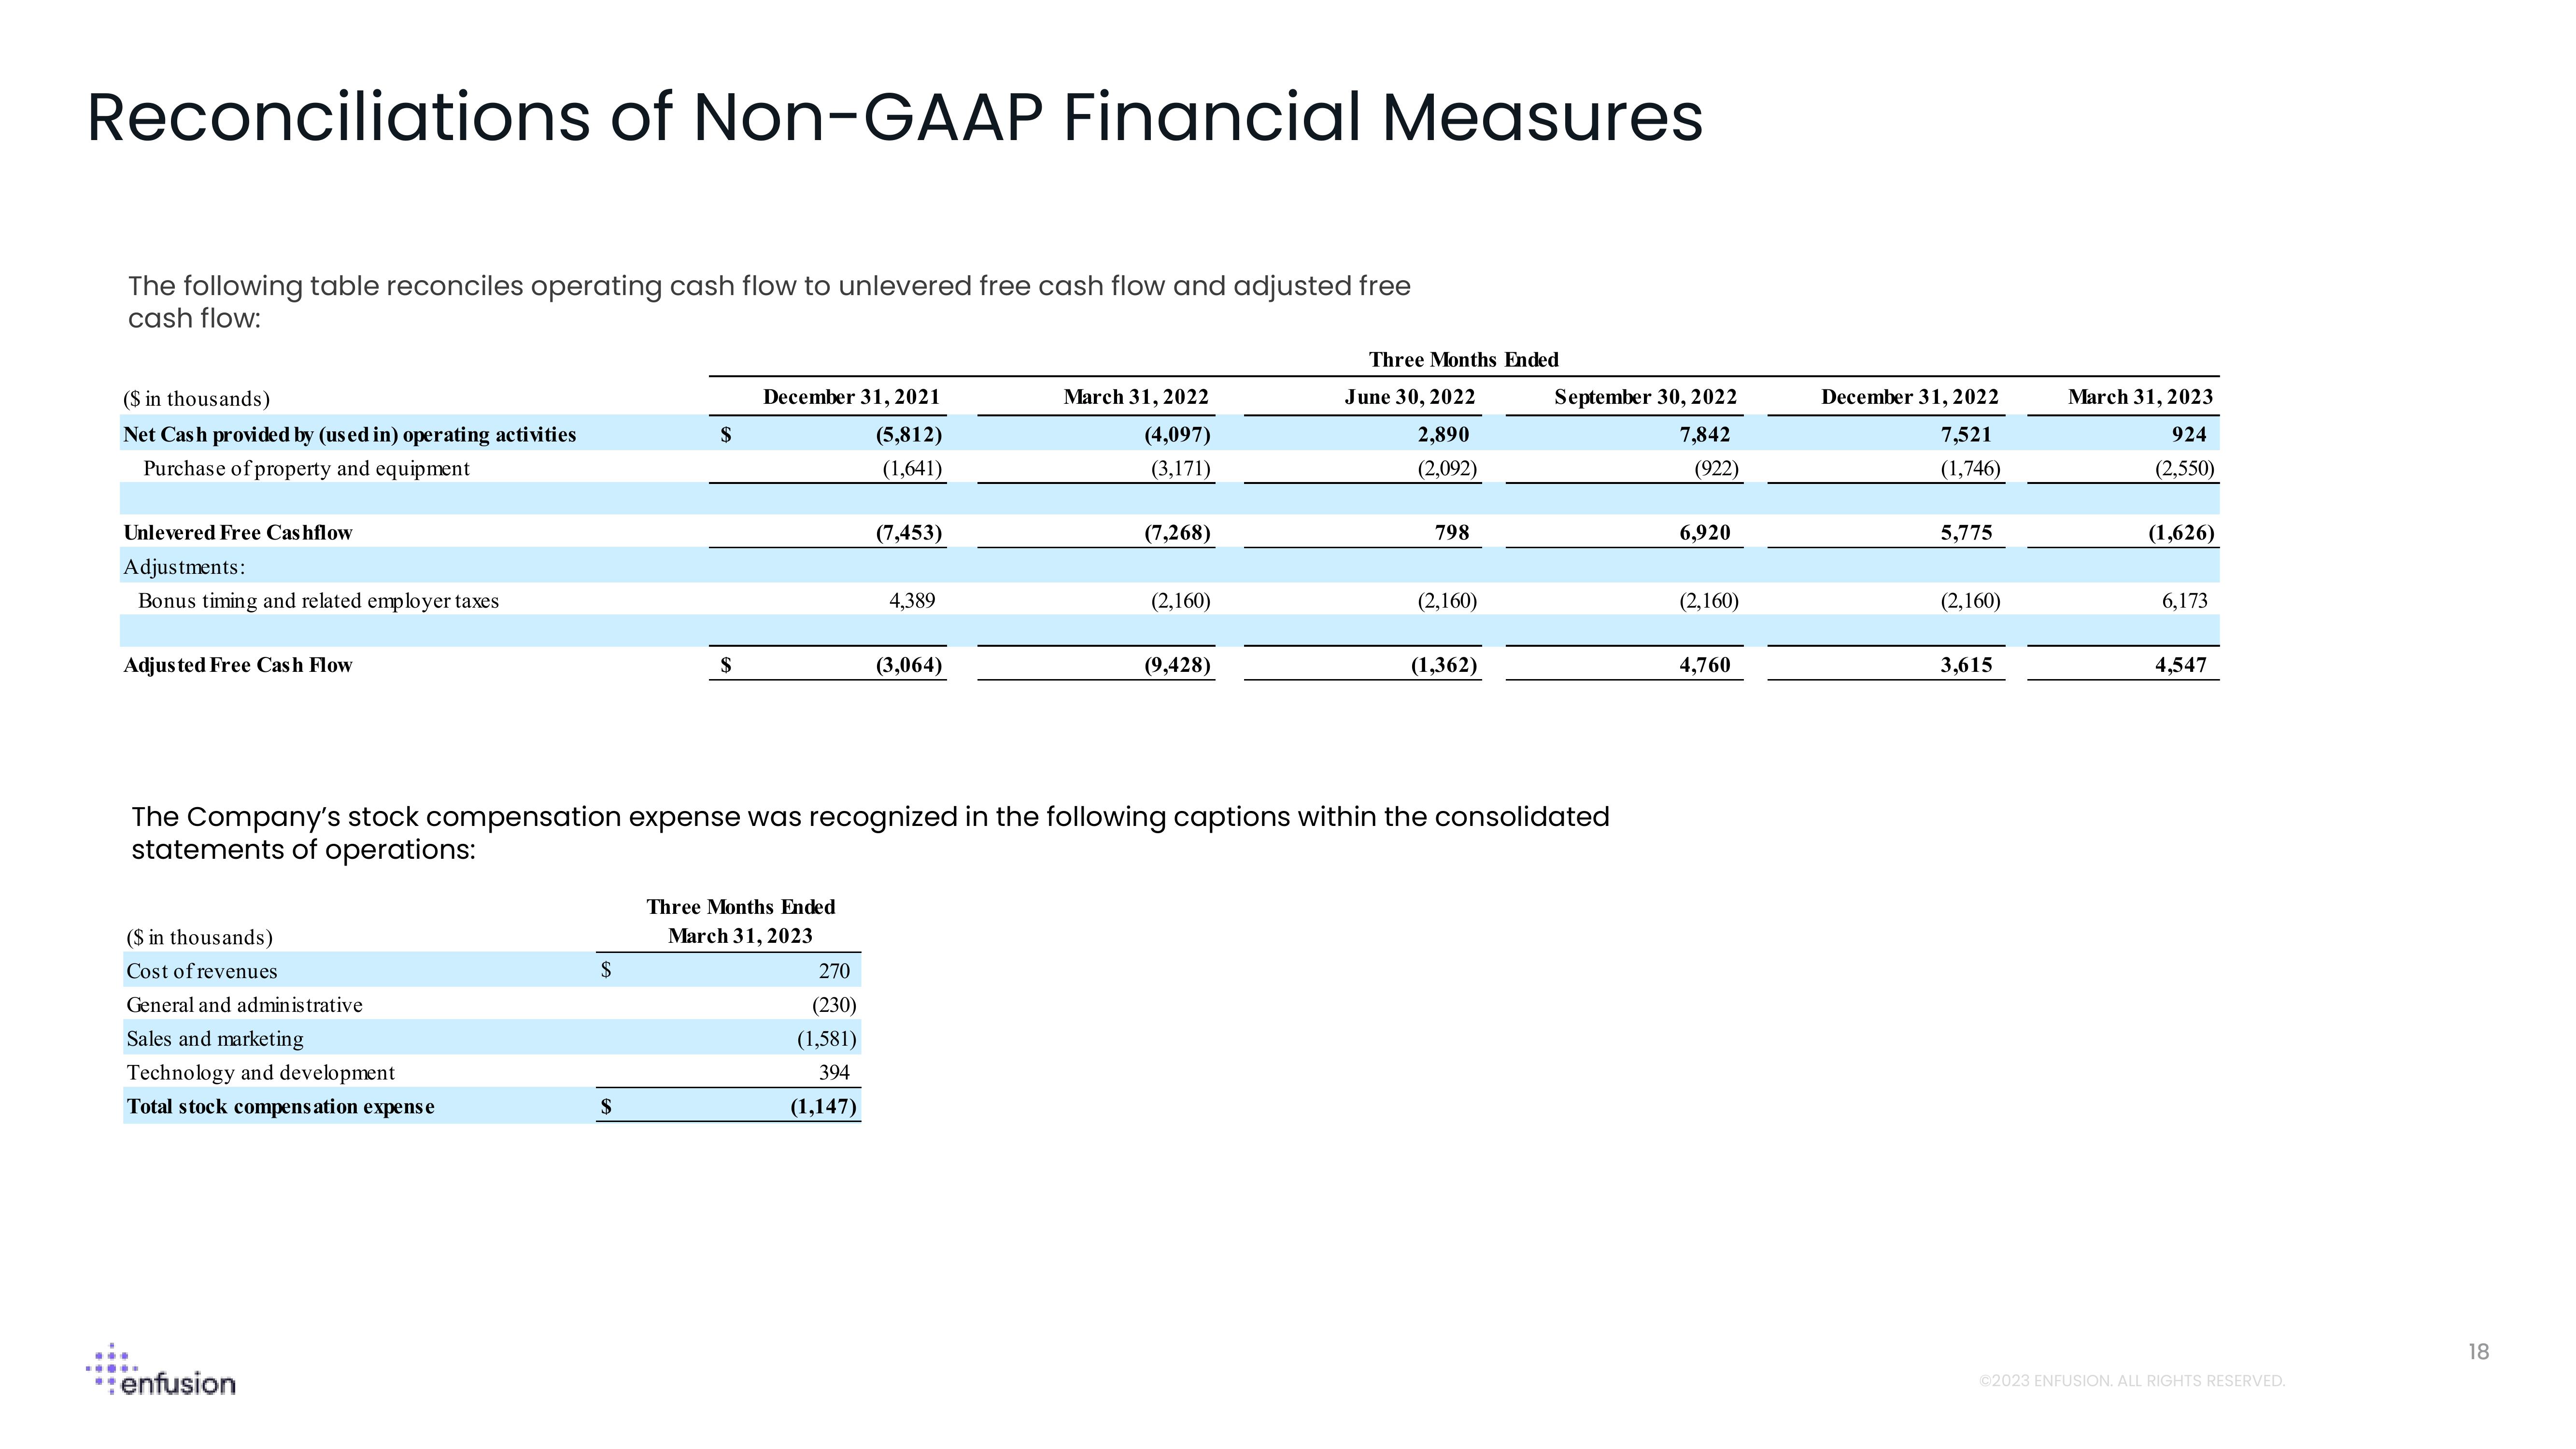
The following table reconciles operating cash flow to unlevered free cash flow and adjusted free
cash flow:
(S in thousands)
Net Cash provided by (used in) operating activities
Purchase of property and equipment
Unlevered Free Cashflow
Adjustments:
Bonus timing and related employer taxes
Adjusted Free Cash Flow
($ in thousands)
Cost of revenues
General and administrative
Sales and marketing
Technology and development
Total stock compensation expense
*:enfusion
$
$
December 31, 2021
(5,812)
(1,641)
Three Months Ended
March 31, 2023
(7,453)
270
(230)
(1,581)
394
(1,147)
4,389
(3,064)
March 31, 2022
(4,097)
(3,171)
(7,268)
(2,160)
(9,428)
Three Months Ended
The Company's stock compensation expense was recognized in the following captions within the consolidated
statements of operations:
June 30, 2022
2,890
(2,092)
798
(2,160)
(1,362)
September 30, 2022
7,842
(922)
6,920
(2,160)
4,760
December 31, 2022
7,521
(1,746)
5,775
(2,160)
3,615
March 31, 2023
924
(2,550)
(1,626)
6,173
4,547
Ⓒ2023 ENFUSION. ALL RIGHTS RESERVED.
18View entire presentation