PropertyGuru SPAC Presentation Deck slide image

PropertyGuru SPAC Presentation Deck

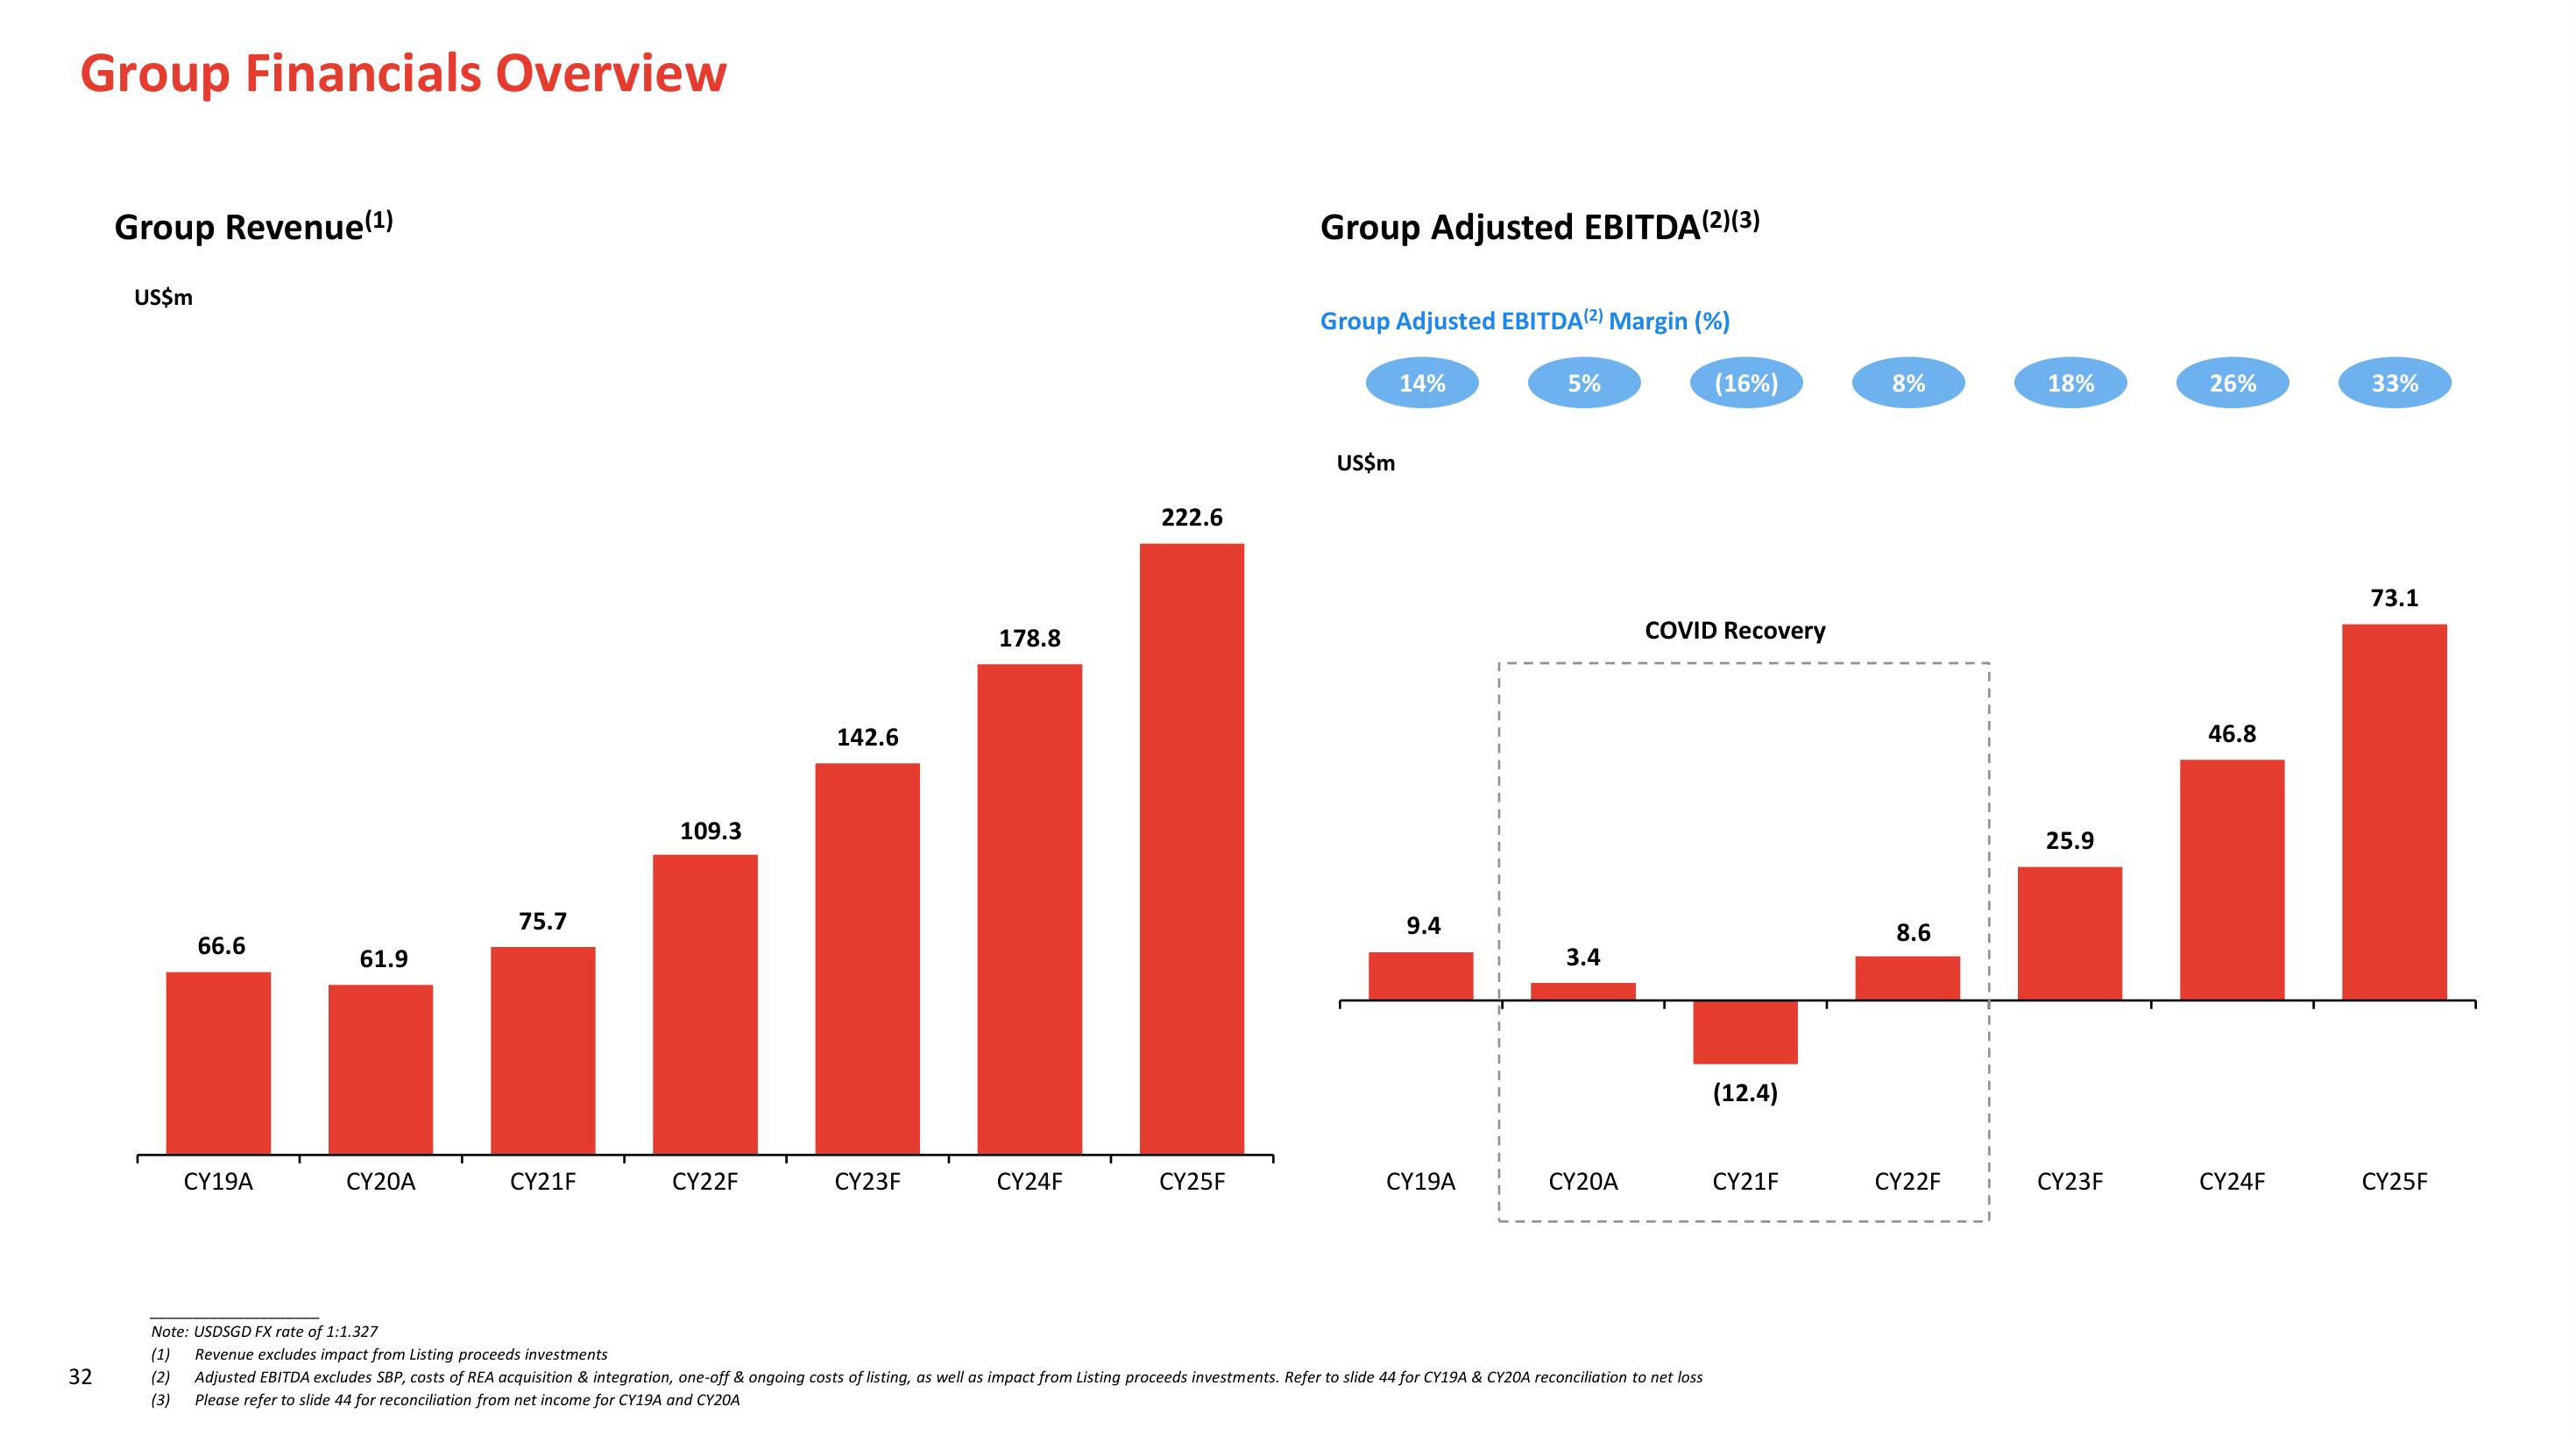
Group Financials Overview 32 Group Revenue (¹) US$m 66.6 CY19A 61.9 CY20A 75.7 CY21F 109.3 CY22F 142.6 CY23F 178.8 CY24F 222.6 CY25F Group Adjusted EBITDA(2)(3) Group Adjusted EBITDA (2) Margin (%) US$m 14% 9.4 CY19A 5% 3.4 CY20A (16%) COVID Recovery Note: USDSGD FX rate of 1:1.327 (1) Revenue excludes impact from Listing proceeds investments (2) Adjusted EBITDA excludes SBP, costs of REA acquisition & integration, one-off & ongoing costs of listing, as well as impact from Listing proceeds investments. Refer to slide 44 for CY19A & CY20A reconciliation to net loss Please refer to slide 44 for reconciliation from net income for CY19A and CY20A (3) (12.4) CY21F 8% 8.6 CY22F I 1 I 18% 25.9 CY23F 26% 46.8 CY24F 33% 73.1 CY25F
View entire presentation