Metals Company SPAC slide image

Metals Company SPAC

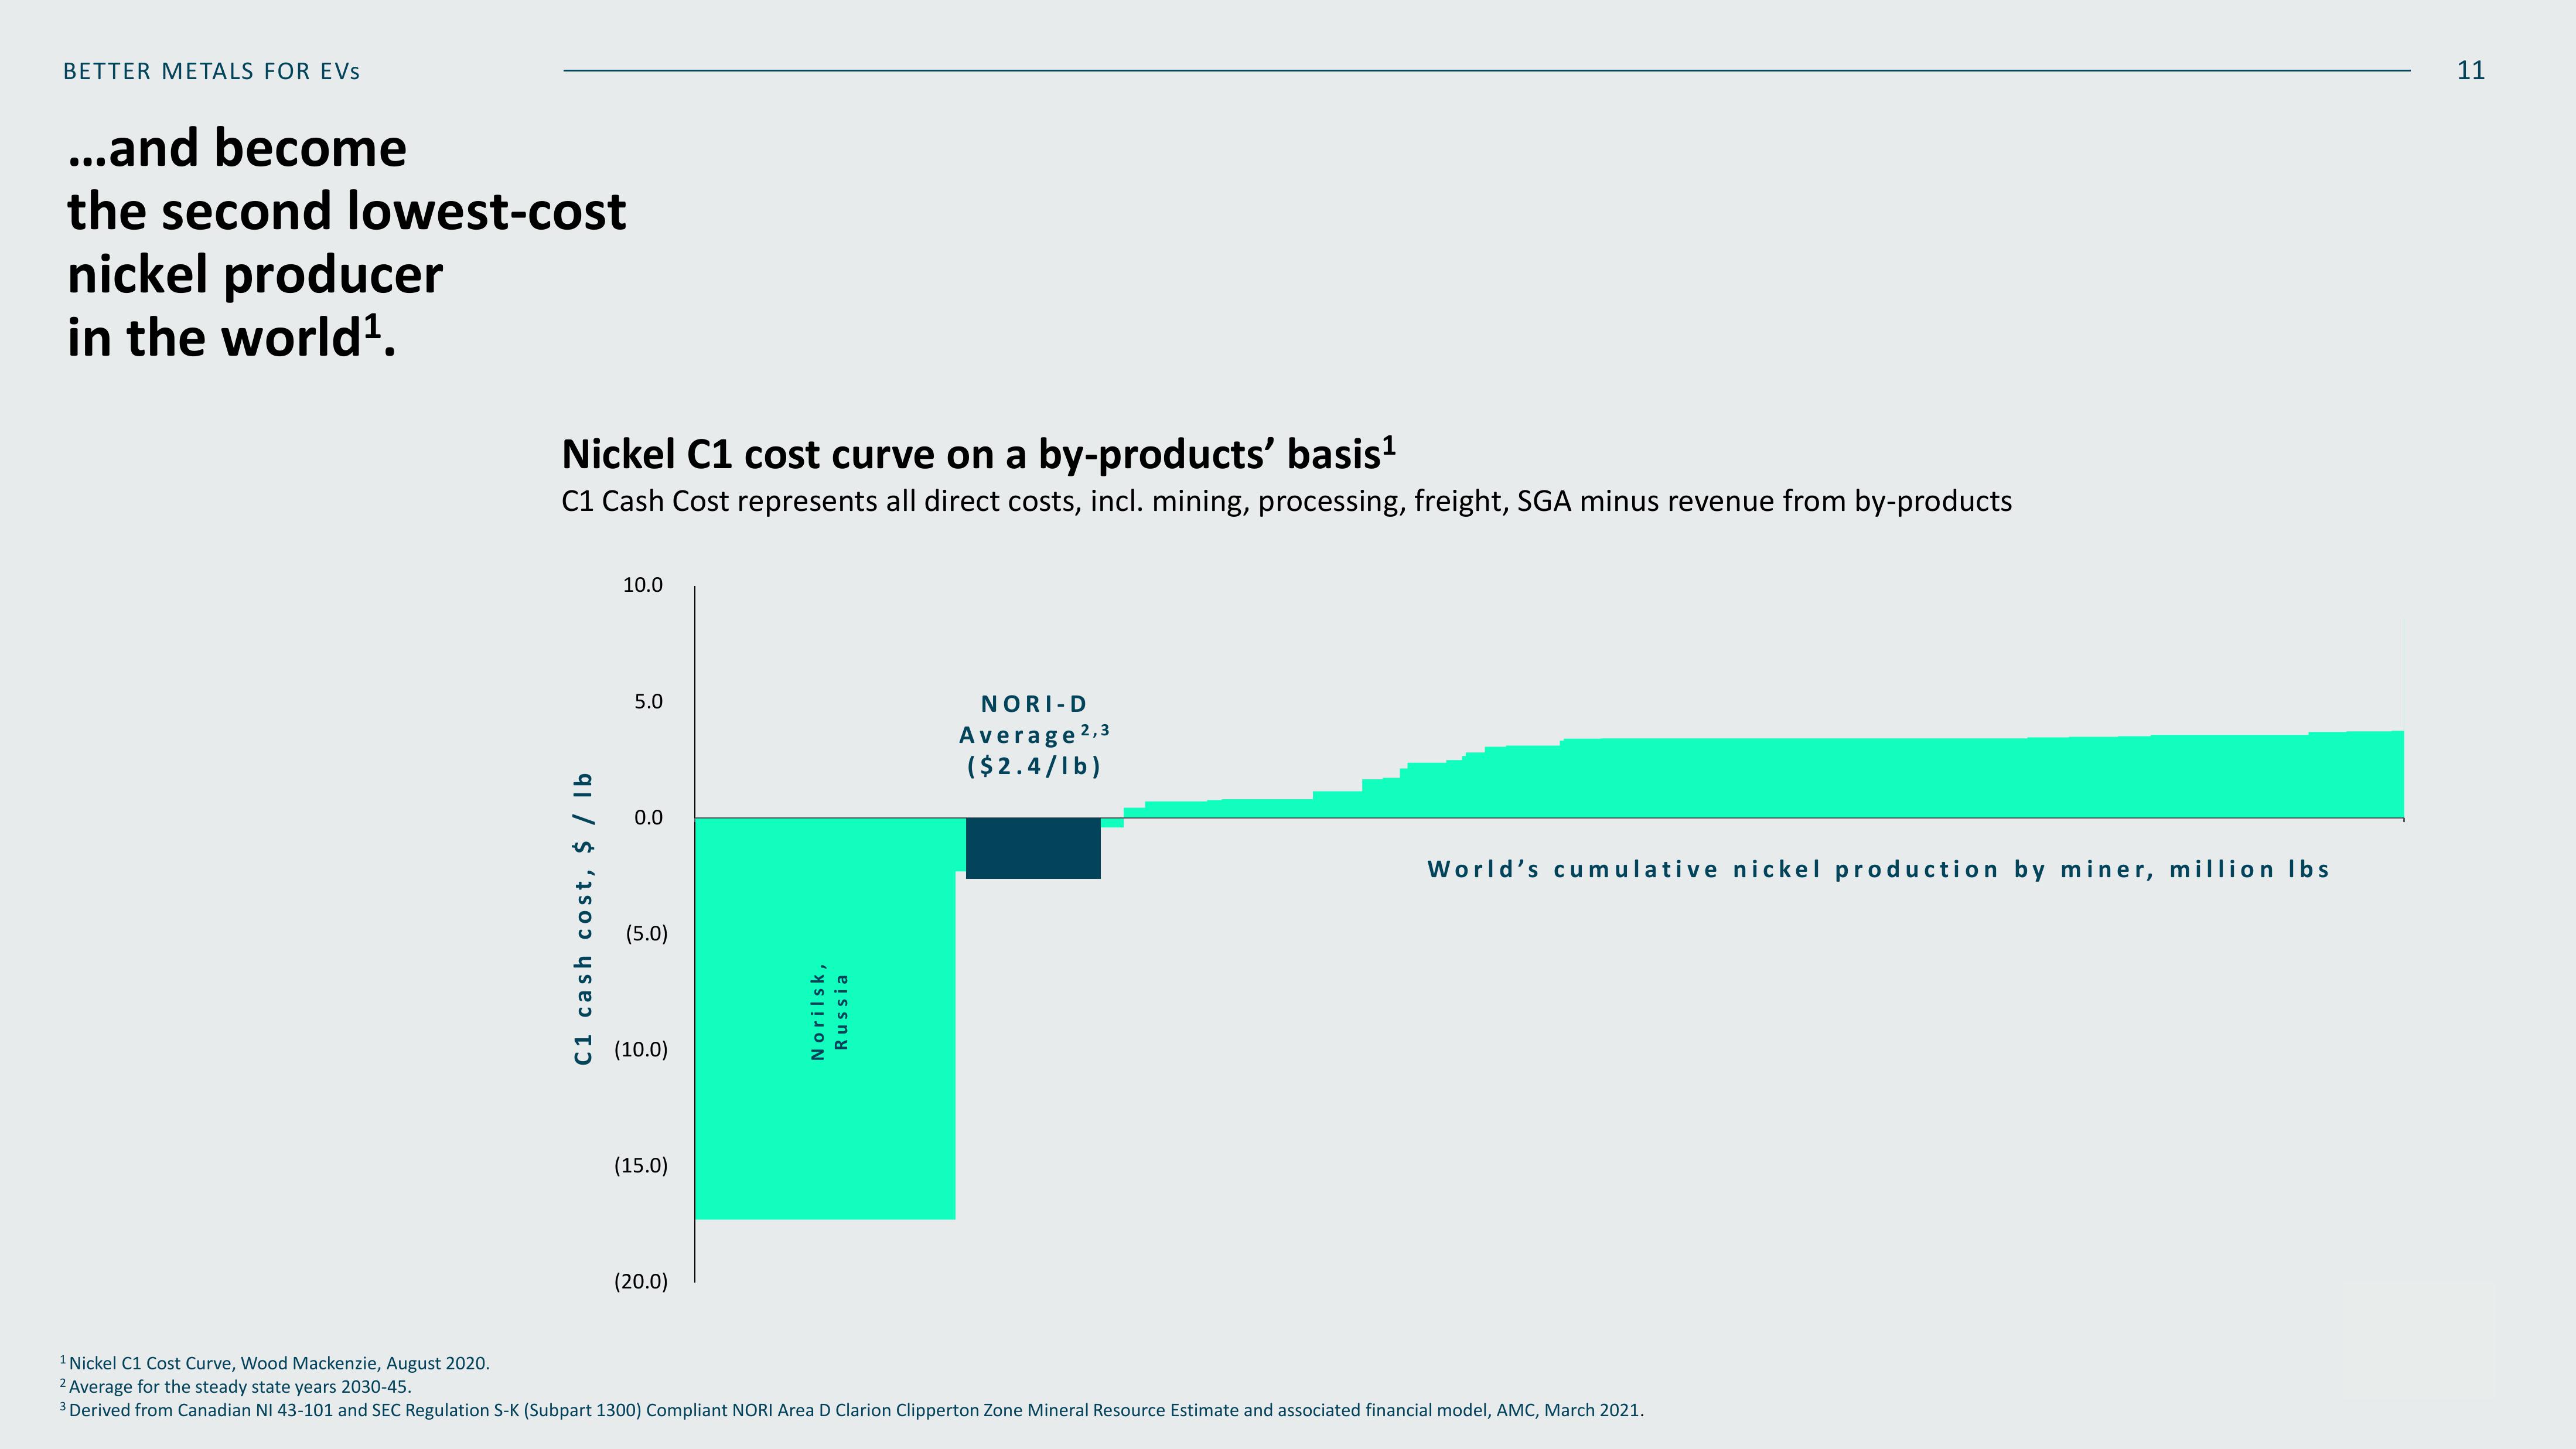
BETTER METALS FOR EVs ...and become the second lowest-cost nickel producer in the world¹. Nickel C1 cost curve on a by-products' basis¹ C1 Cash Cost represents all direct costs, incl. mining, processing, freight, SGA minus revenue from by-products C1 cash cost, $ / lb 10.0 5.0 0.0 (5.0) (10.0) (15.0) (20.0) Norilsk, Russia NORI-D Average 2,3 ($2.4/1b) World's cumulative nickel production by miner, million lbs 1 Nickel C1 Cost Curve, Wood Mackenzie, August 2020. 2 Average for the steady state years 2030-45. ³ Derived from Canadian NI 43-101 and SEC Regulation S-K (Subpart 1300) Compliant NORI Area D Clarion Clipperton Zone Mineral Resource Estimate and associated financial model, AMC, March 2021. 11
View entire presentation