Azek IPO Presentation Deck
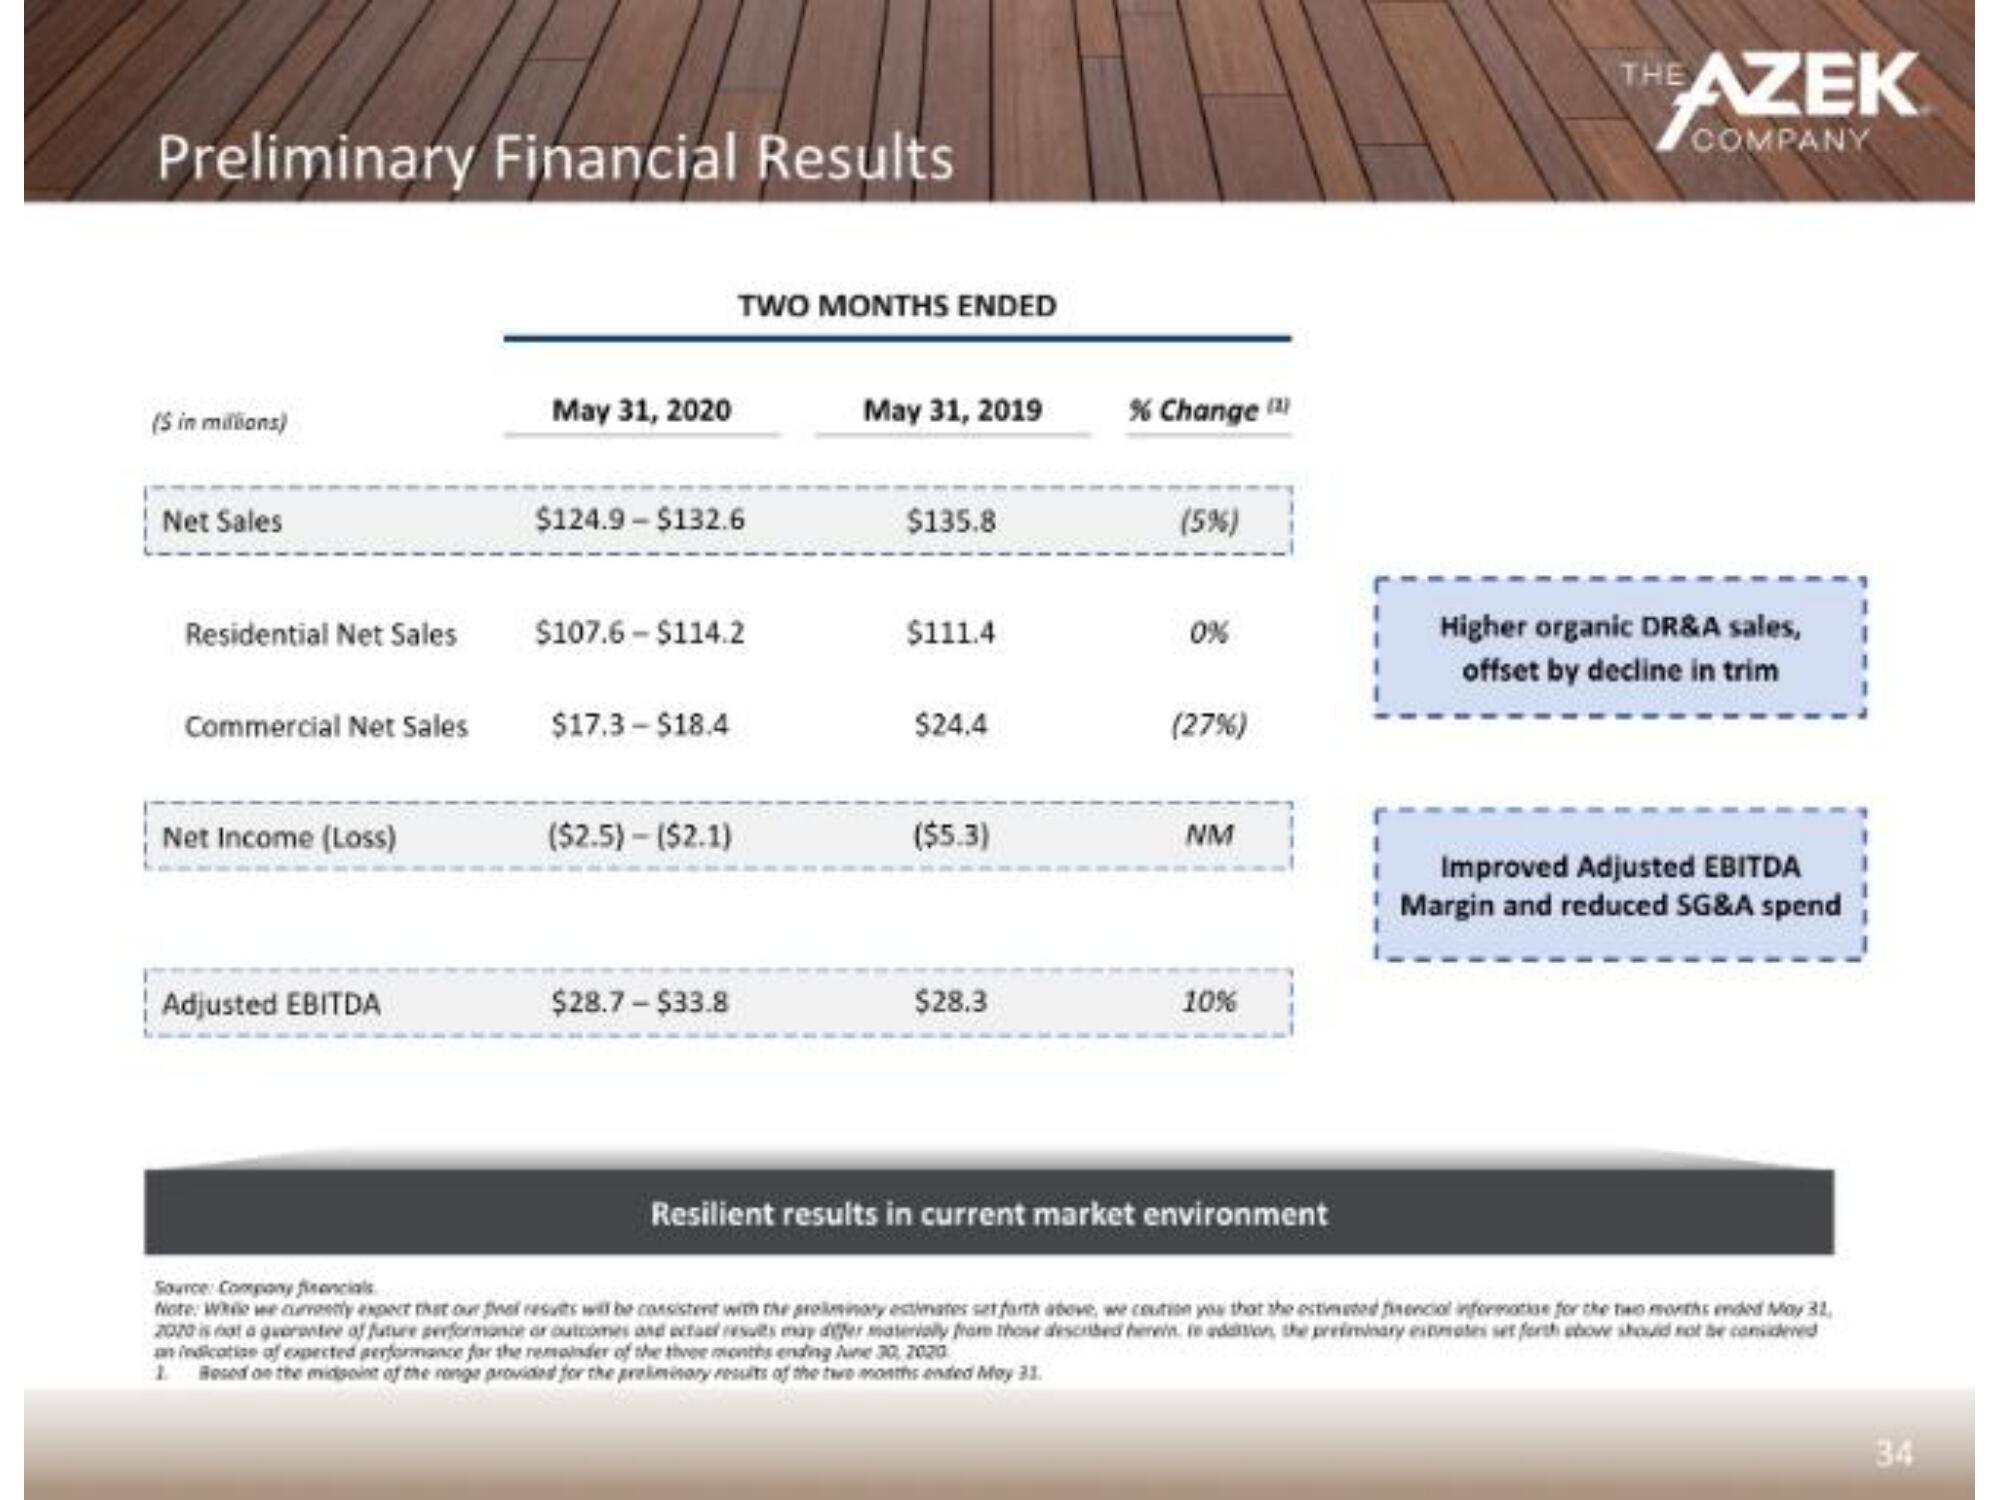
Preliminary Financial Results
(S in millions)
Net Sales
Residential Net Sales
Commercial Net Sales
Net Income (Loss)
Adjusted EBITDA
May 31, 2020
$124.9-$132.6
$107.6-$114.2
$17.3-$18.4
TWO MONTHS ENDED
($2.5) -($2.1)
$28.7 - $33.8
May 31, 2019
$135.8
$111.4
$24.4
($5.3)
$28.3
% Change (1)
(5%)
0%
(27%)
NM
10%
Resilient results in current market environment
THE AZEK
COMPANY
Higher organic DR&A sales,
offset by decline in trim
Improved Adjusted EBITDA
Margin and reduced SG&A spend
Company financials
Note: While we currently expect that our final results will be consistent with the preliminary estimates set forth above, we coution you that the estimated pinencial informative for the two months ended May 31,
2020 is not a guarantee of future performance or outcomes and ectacf results may differ materially from those described herein te addition, the preliminary estimates set forth above should not be considered
an indication of expected performance for the remainder of the three months ending June 30, 2020
1 Besed on the midpoint of the range provided for the preliminary results of the two months ended May 31.
34View entire presentation