Allego Investor Presentation Deck
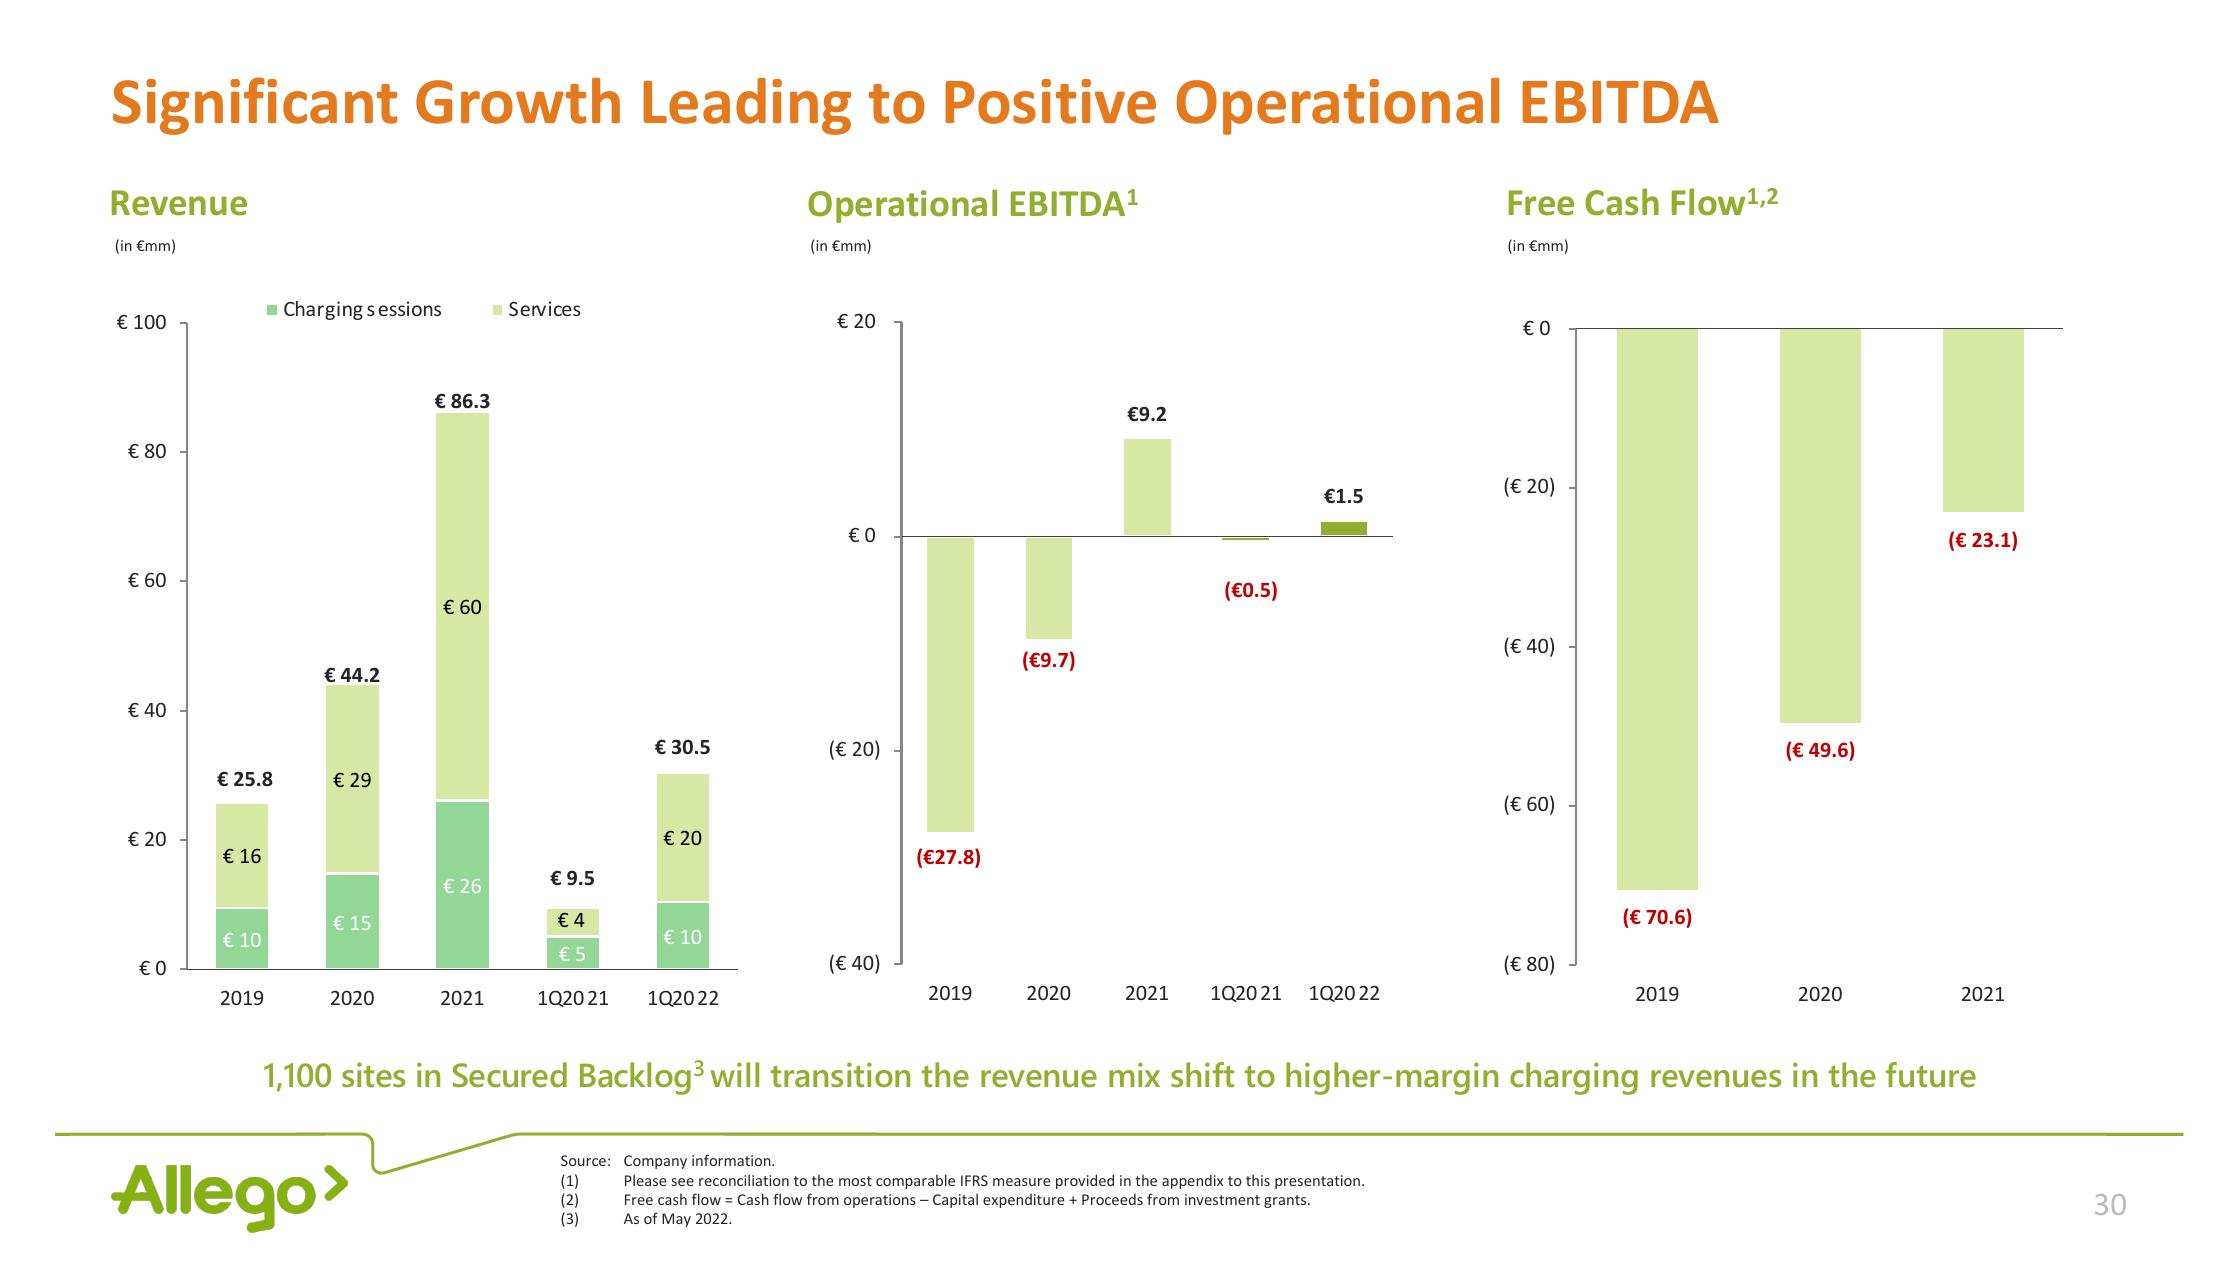
Significant Growth Leading to Positive Operational EBITDA
Operational EBITDA¹
Revenue
(in €mm)
€ 100
€ 80
€ 60
€ 40
€ 20
€ 0
€ 25.8
€ 16
€ 10
2019
Charging sessions
€ 44.2
€ 29
€ 15
2020
€ 86.3
Allego>
€ 60
€ 26
2021
Services
€ 9.5
€ 4
€ 5
1Q20 21
€ 30.5
€ 20
(1)
(2)
(3)
€ 10
102022
(in €mm)
€ 20
€ 0
(€ 20)
(€ 40)
(€27.8)
2019
(€9.7)
2020
€9.2
(€0.5)
€1.5
2021 1Q20 21 1020 22
Source: Company information.
Please see reconciliation to the most comparable IFRS measure provided in the appendix to this presentation.
Free cash flow = Cash flow from operations - Capital expenditure + Proceeds from investment grants.
As of May 2022.
Free Cash Flow ¹,2
(in €mm)
€ 0
(€ 20)
(€ 40)
(€ 60)
(€ 80)
(€ 70.6)
2019
(€ 49.6)
2020
1,100 sites in Secured Backlog³ will transition the revenue mix shift to higher-margin charging revenues in the future
(€ 23.1)
2021
30View entire presentation