J.P.Morgan Results Presentation Deck slide image

J.P.Morgan Results Presentation Deck

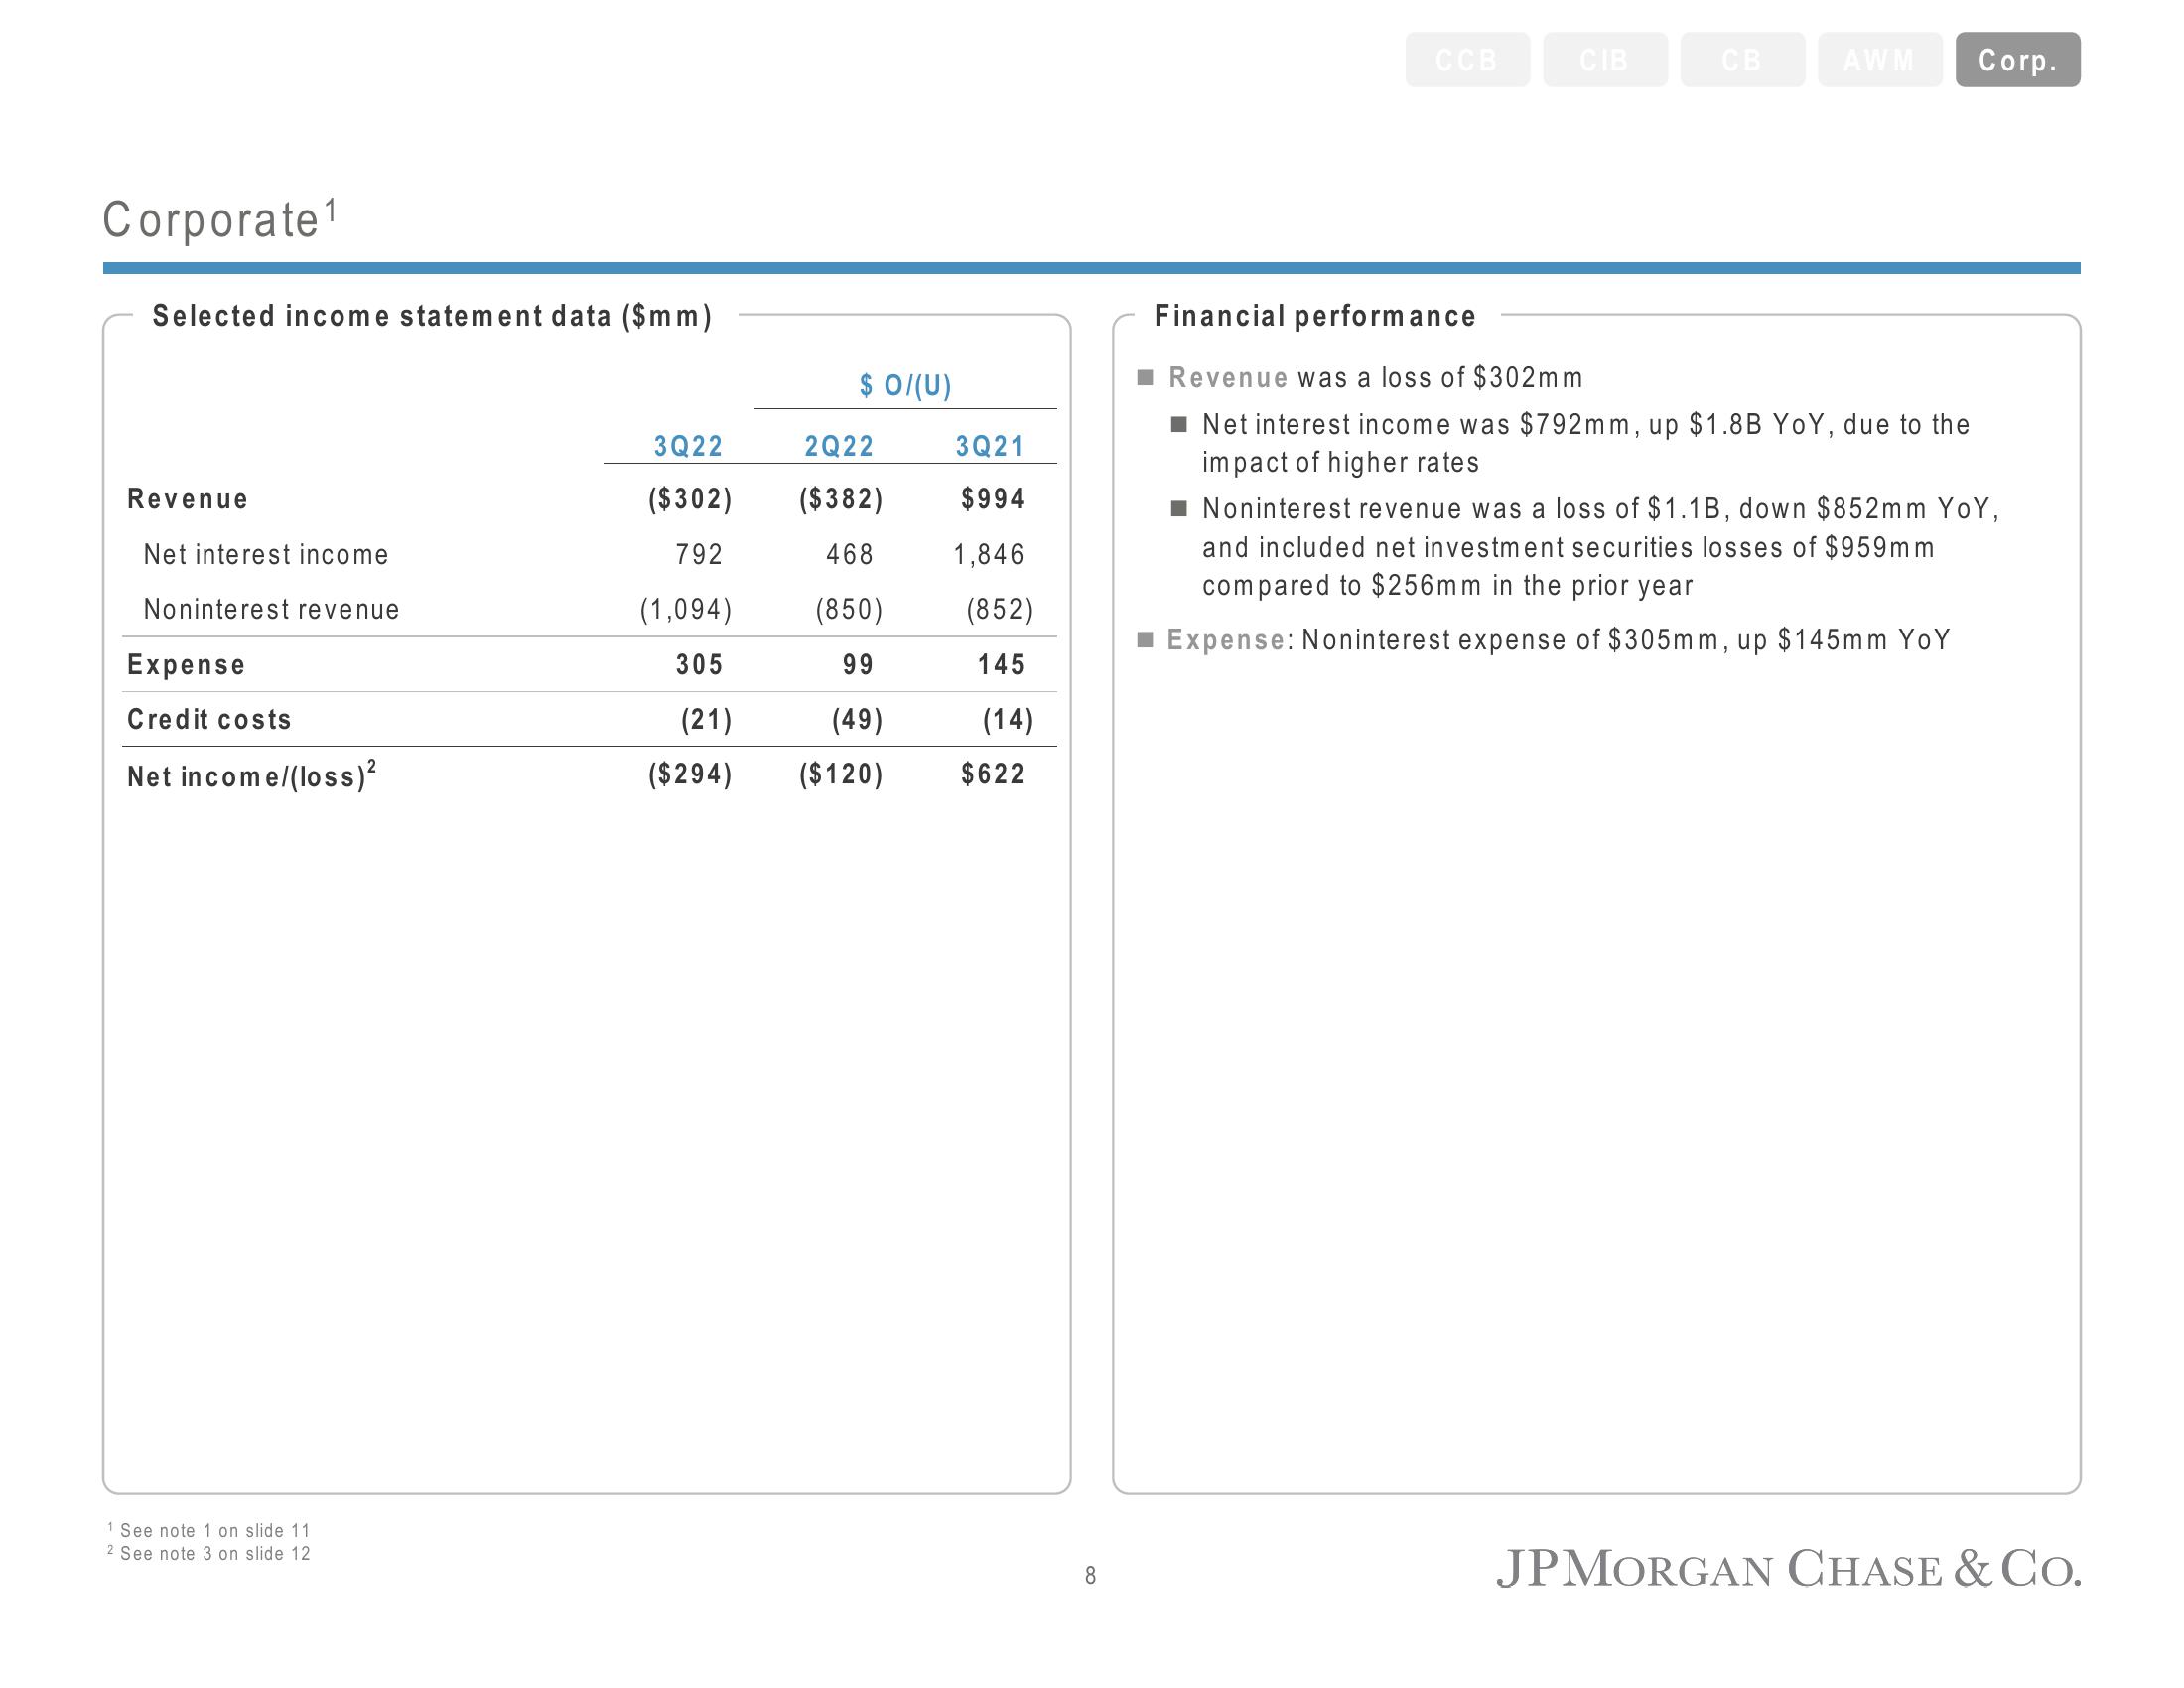
Corporate¹ Selected income statement data ($mm) Revenue Net interest income Noninterest revenue Expense Credit costs Net income/(loss)² 1 See note 1 on slide 11 2 See note 3 on slide 12 3Q22 ($302) 792 (1,094) 305 (21) ($294) $ 0/(U) 2Q22 ($382) 468 (850) 99 (49) ($120) 3Q21 $994 1,846 (852) 145 (14) $622 8 CCB CIB CB AWM Corp. Financial performance Revenue was a loss of $302mm ■ Net interest income was $792mm, up $1.8B YoY, due to the impact of higher rates ■ Noninterest revenue was a loss of $1.1B, down $852mm YoY, and included net investment securities losses of $959mm compared to $256mm in the prior year ■ Expense: Noninterest expense of $305mm, up $145mm YoY JPMORGAN CHASE & Co.
View entire presentation