Ares US Real Estate Opportunity Fund III
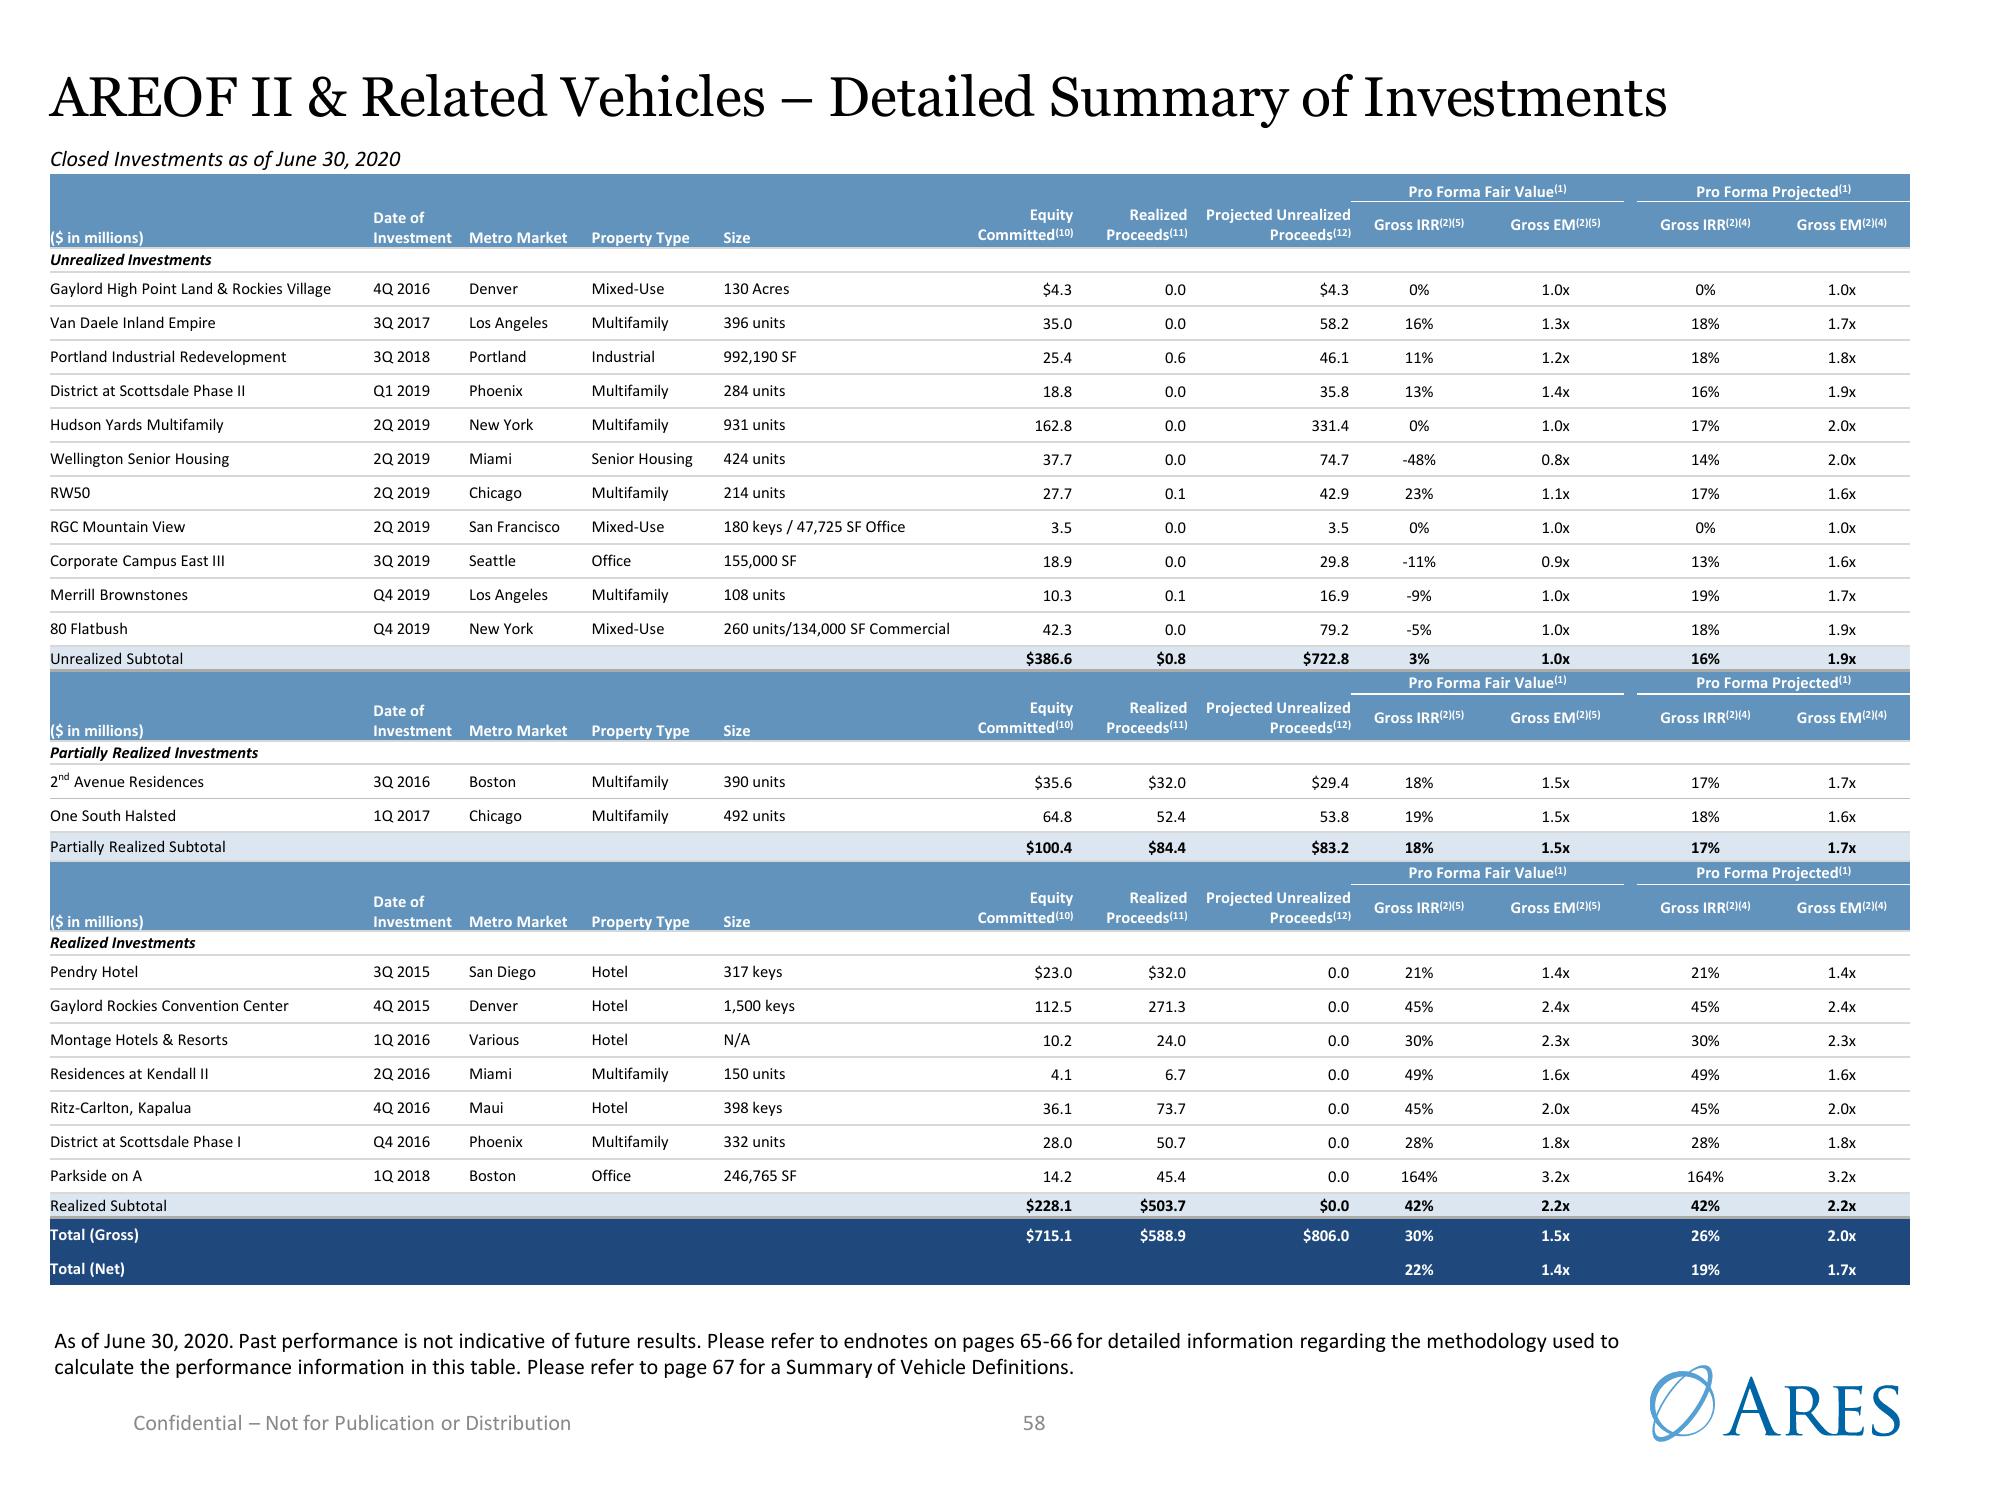
AREOF II & Related Vehicles - Detailed Summary of Investments
Closed Investments as of June 30, 2020
($ in millions)
Unrealized Investments
Gaylord High Point Land & Rockies Village
Van Daele Inland Empire
Portland Industrial Redevelopment
District at Scottsdale Phase II
Hudson Yards Multifamily
Wellington Senior Housing
RW50
RGC Mountain View
Corporate Campus East III
Merrill Brownstones
80 Flatbush
Unrealized Subtotal
($ in millions)
Partially Realized Investments
2nd Avenue Residences
One South Halsted
Partially Realized Subtotal
($ in millions)
Realized Investments
Pendry Hotel
Gaylord Rockies Convention Center
Montage Hotels & Resorts
Residences at Kendall II
Ritz-Carlton, Kapalua
District at Scottsdale Phase I
Parkside on A
Realized Subtotal
Total (Gross)
Total (Net)
Date of
Investment Metro Market
4Q 2016
3Q 2017
3Q 2018
Q1 2019
2Q 2019
2Q 2019
2Q 2019
2Q 2019
3Q 2019
Q4 2019
Q4 2019
3Q 2016
1Q 2017
3Q 2015
Date of
Investment Metro Market
4Q 2015
1Q 2016
2Q 2016
Denver
4Q 2016
Q4 2016
Los Angeles
Portland
Phoenix
New York
Miami
Chicago
1Q 2018
San Francisco
Date of
Investment Metro Market
Seattle
Los Angeles
New York
Boston
Chicago
San Diego
Denver
Various
Miami
Maui
Phoenix
Boston
Property Type
Confidential - Not for Publication or Distribution
Mixed-Use
Multifamily
Industrial
Multifamily
Multifamily
Senior Housing
Multifamily
Mixed-Use
Office
Multifamily
Mixed-Use
Property Type
Multifamily
Multifamily
Property Type
Hotel
Hotel
Hotel
Multifamily
Hotel
Multifamily
Office
Size
130 Acres
396 units
992,190 SF
284 units.
931 units
424 units
214 units
180 keys / 47,725 SF Office
155,000 SF
108 units
260 units/134,000 SF Commercial
Size
390 units
492 units
Size
317 keys
1,500 keys
N/A
150 units
398 keys
332 units
246,765 SF
Equity
Committed (10)
$4.3
35.0
25.4
18.8
162.8
37.7
27.7
3.5
18.9
10.3
42.3
$386.6
Equity
Committed (10)
$35.6
64.8
$100.4
Equity
Committed (10)
$23.0
112.5
10.2
4.1
36.1
28.0
14.2
$228.1
$715.1
58
Realized Projected Unrealized
Proceeds(11)
Proceeds(12)
0.0
0.0
0.6
0.0
0.0
0.0
0.1
0.0
0.0
0.1
0.0
$0.8
$32.0
52.4
$84.4
$32.0
271.3
24.0
6.7
73.7
$4.3
58.2
50.7
46.1
45.4
$503.7
$588.9
35.8
331.4
Realized Projected Unrealized
Proceeds(11)
Proceeds (12)
74.7
42.9
3.5
29.8
Realized Projected Unrealized
Proceeds(11)
Proceeds(12)
16.9
79.2
$722.8
$29.4
53.8
$83.2
0.0
0.0
0.0
0.0
0.0
0.0
0.0
$0.0
$806.0
Pro Forma Fair Value(¹)
Gross IRR(2)(5)
0%
16%
11%
13%
0%
-48%
23%
0%
-11%
Gross IRR(2)(5)
18%
Gross IRR(2)(5)
21%
45%
30%
49%
45%
-9%
1.0x
-5%
3%
Pro Forma Fair Value(¹)
1.0x
28%
164%
42%
Gross EM(2)(5)
30%
1.0x
22%
1.3x
1.2x
1.4x
19%
1.5x
18%
1.5x
Pro Forma Fair Value(¹)
1.0x
0.8x
1.1x
1.0x
0.9x
1.0x
Gross EM(2)(5)
1.5x
Gross EM(2)(5)
1.4x
2.4x
2.3x
1.6x
2.0x
1.8x
3.2x
2.2x
1.5x
As of June 30, 2020. Past performance is not indicative of future results. Please refer to endnotes on pages 65-66 for detailed information regarding the methodology used to
calculate the performance information in this table. Please refer to page 67 for a Summary of Vehicle Definitions.
1.4x
Pro Forma Projected(¹)
Gross IRR(2)(4) Gross EM(2)(4)
0%
18%
18%
16%
17%
14%
17%
0%
13%
19%
Gross IRR(2)(4)
17%
Gross IRR(2)(4)
21%
45%
30%
49%
45%
18%
16%
Pro Forma Projected(¹)
28%
1.0x
164%
42%
26%
1.7x
19%
1.8x
1.9x
2.0x
18%
17%
Pro Forma Projected(¹)
2.0x
1.6x
1.0x
1.6x
1.7x
1.9x
1.9x
Gross EM(2)(4)
1.7x
1.6x
1.7x
Gross EM(2)(4)
1.4x
2.4x
2.3x
1.6x
2.0x
1.8x
3.2x
2.2x
2.0x
1.7x
ARESView entire presentation