Netstreit Investor Presentation Deck
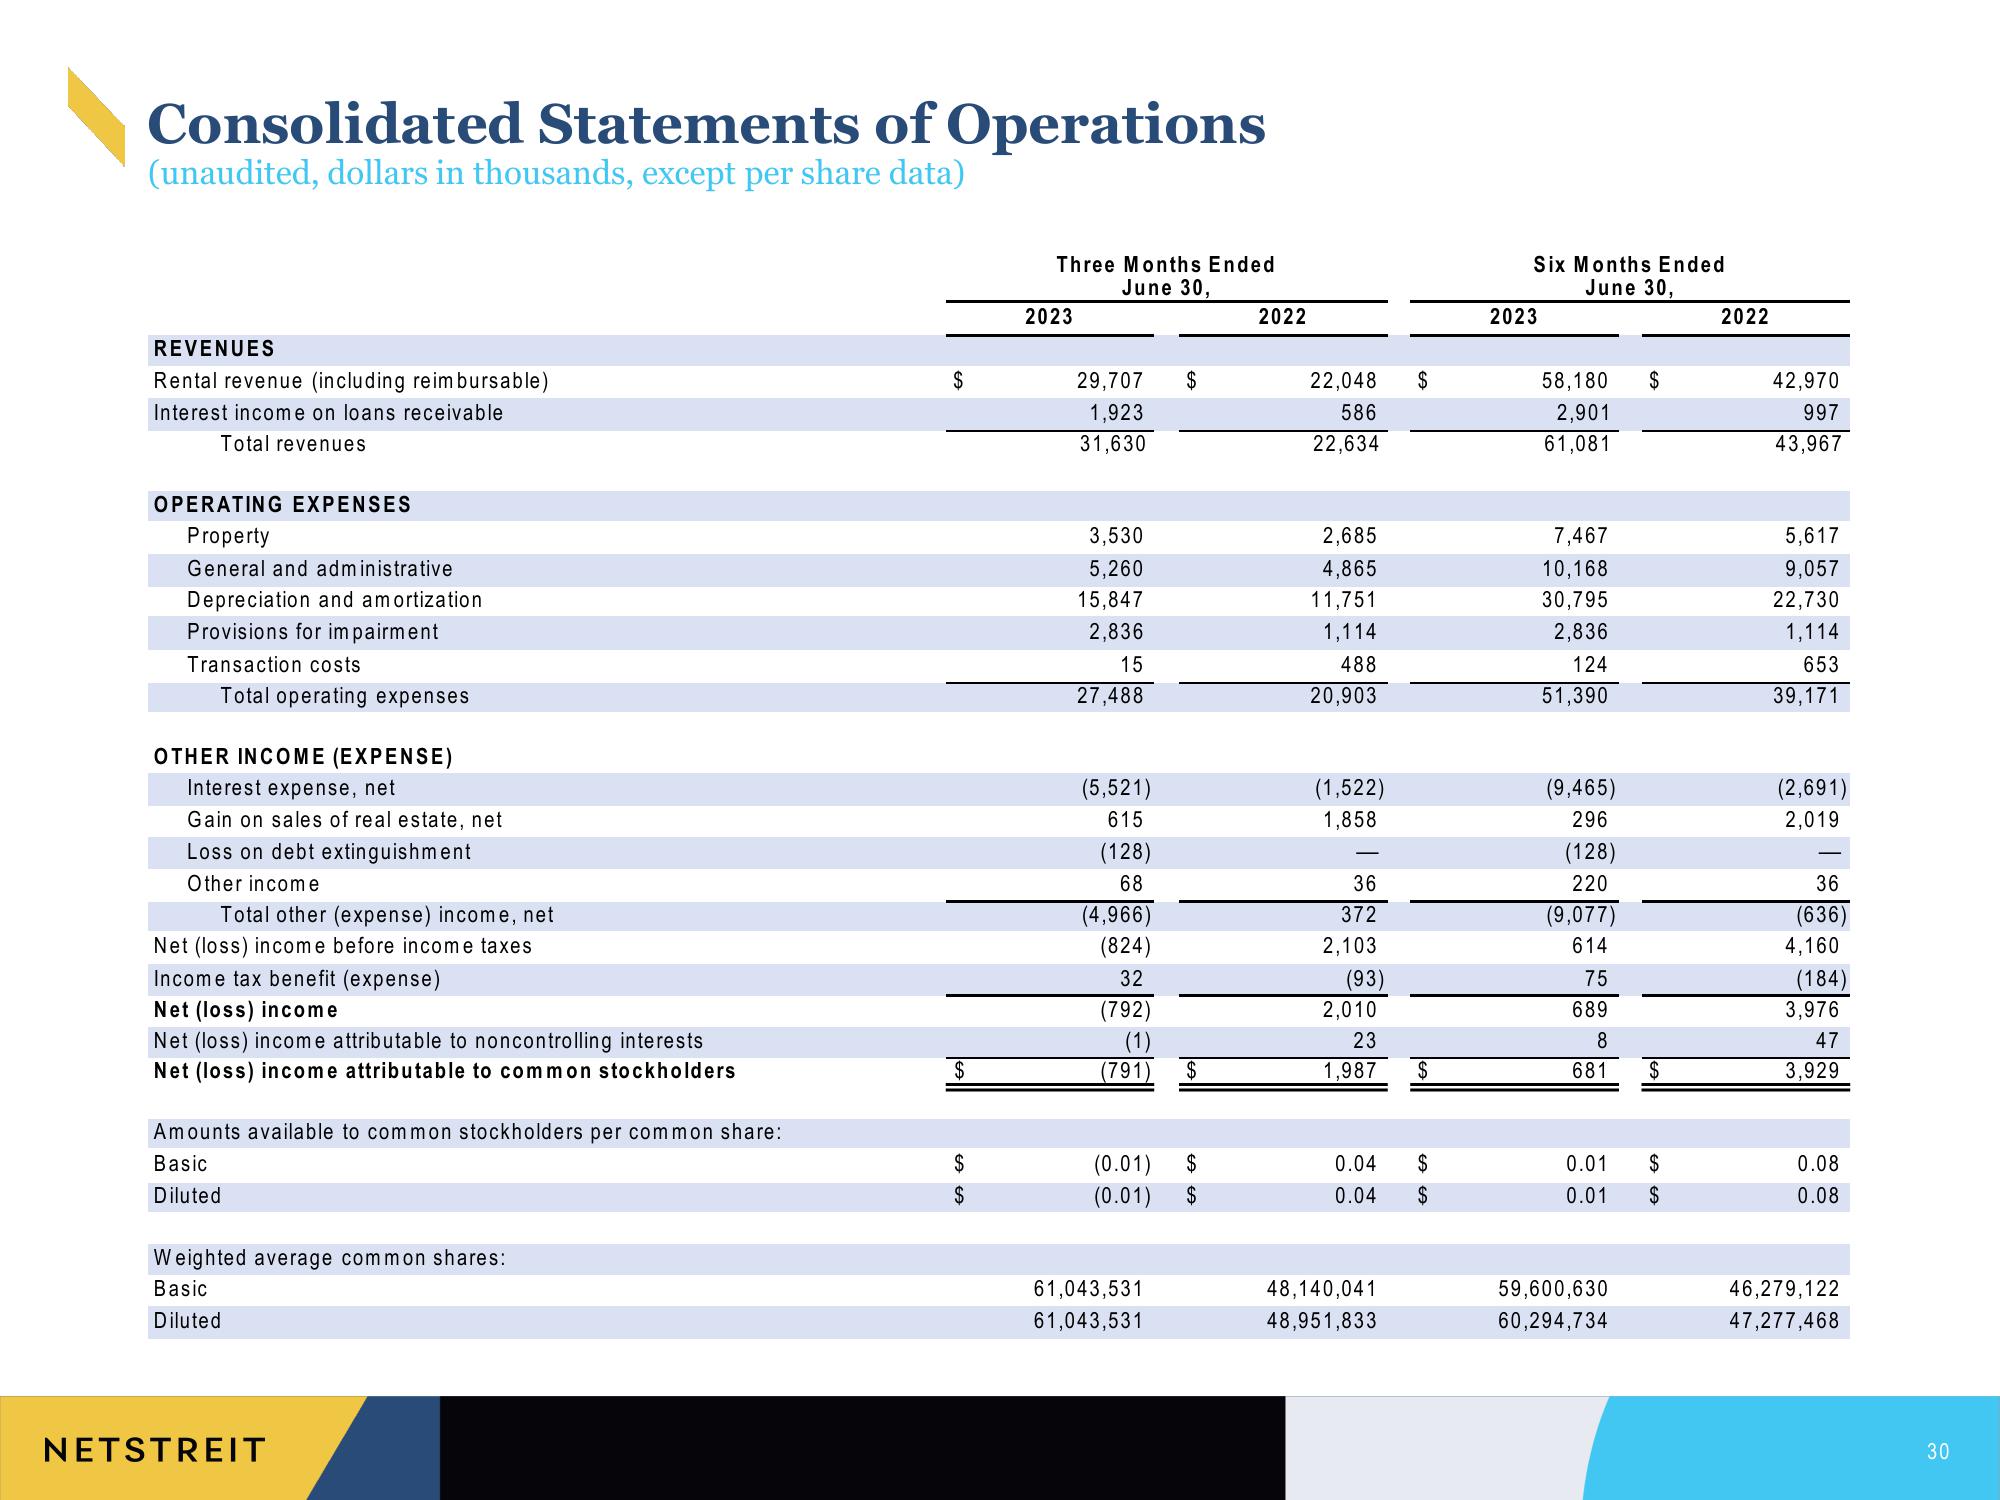
Consolidated Statements of Operations
(unaudited, dollars in thousands, except per share data)
REVENUES
Rental revenue (including reimbursable)
Interest income on loans receivable
Total revenues
OPERATING EXPENSES
Property
General and administrative
Depreciation and amortization
Provisions for impairment
Transaction costs
Total operating expenses
OTHER INCOME (EXPENSE)
Interest expense, net
Gain on sales of real estate, net
Loss on debt extinguishment
Other income
Total other (expense) income, net
Net (loss) income before income taxes
Income tax benefit (expense)
Net (loss) income
Net (loss) income attributable to noncontrolling interests
Net (loss) income attributable to common stockholders
Amounts available to common stockholders per common share:
Basic
Diluted
Weighted average common shares:
Basic
Diluted
NETSTREIT
$
$
$
$
Three Months Ended
June 30,
2023
29,707 $
1,923
31,630
3,530
5,260
15,847
2,836
15
27,488
(5,521)
615
(128)
68
(4,966)
(824)
32
(792)
(1)
(791)
(0.01)
(0.01)
61,043,531
61,043,531
$
$
$
2022
22,048
586
22,634
2,685
4,865
11,751
1,114
488
20,903
(1,522)
1,858
36
372
2,103
(93)
2,010
23
1,987
$
48,140,041
48,951,833
$
0.04 $
0.04
$
Six Months Ended
June 30,
2023
58,180
2,901
61,081
7,467
10,168
30,795
2,836
124
51,390
(9,465)
296
(128)
220
(9,077)
614
75
689
8
681
$
59,600,630
60,294,734
$
0.01 $
0.01
$
2022
42,970
997
43,967
5,617
9,057
22,730
1,114
653
39,171
(2,691)
2,019
36
(636)
4,160
(184)
3,976
47
3,929
0.08
0.08
46,279,122
47,277,468
30View entire presentation