Summit Hotel Properties Investor Presentation Deck
12
Premier Portfolio with Broad Geographic Diversification and
Concentration in High Growth Sun Belt Markets
Summit Markets
Dallas-Fort Worth
New Orleans
Miami-Fort Lauderdale
Portland
Atlanta
Baltimore
Houston
San Francisco
Phoenix
Denver
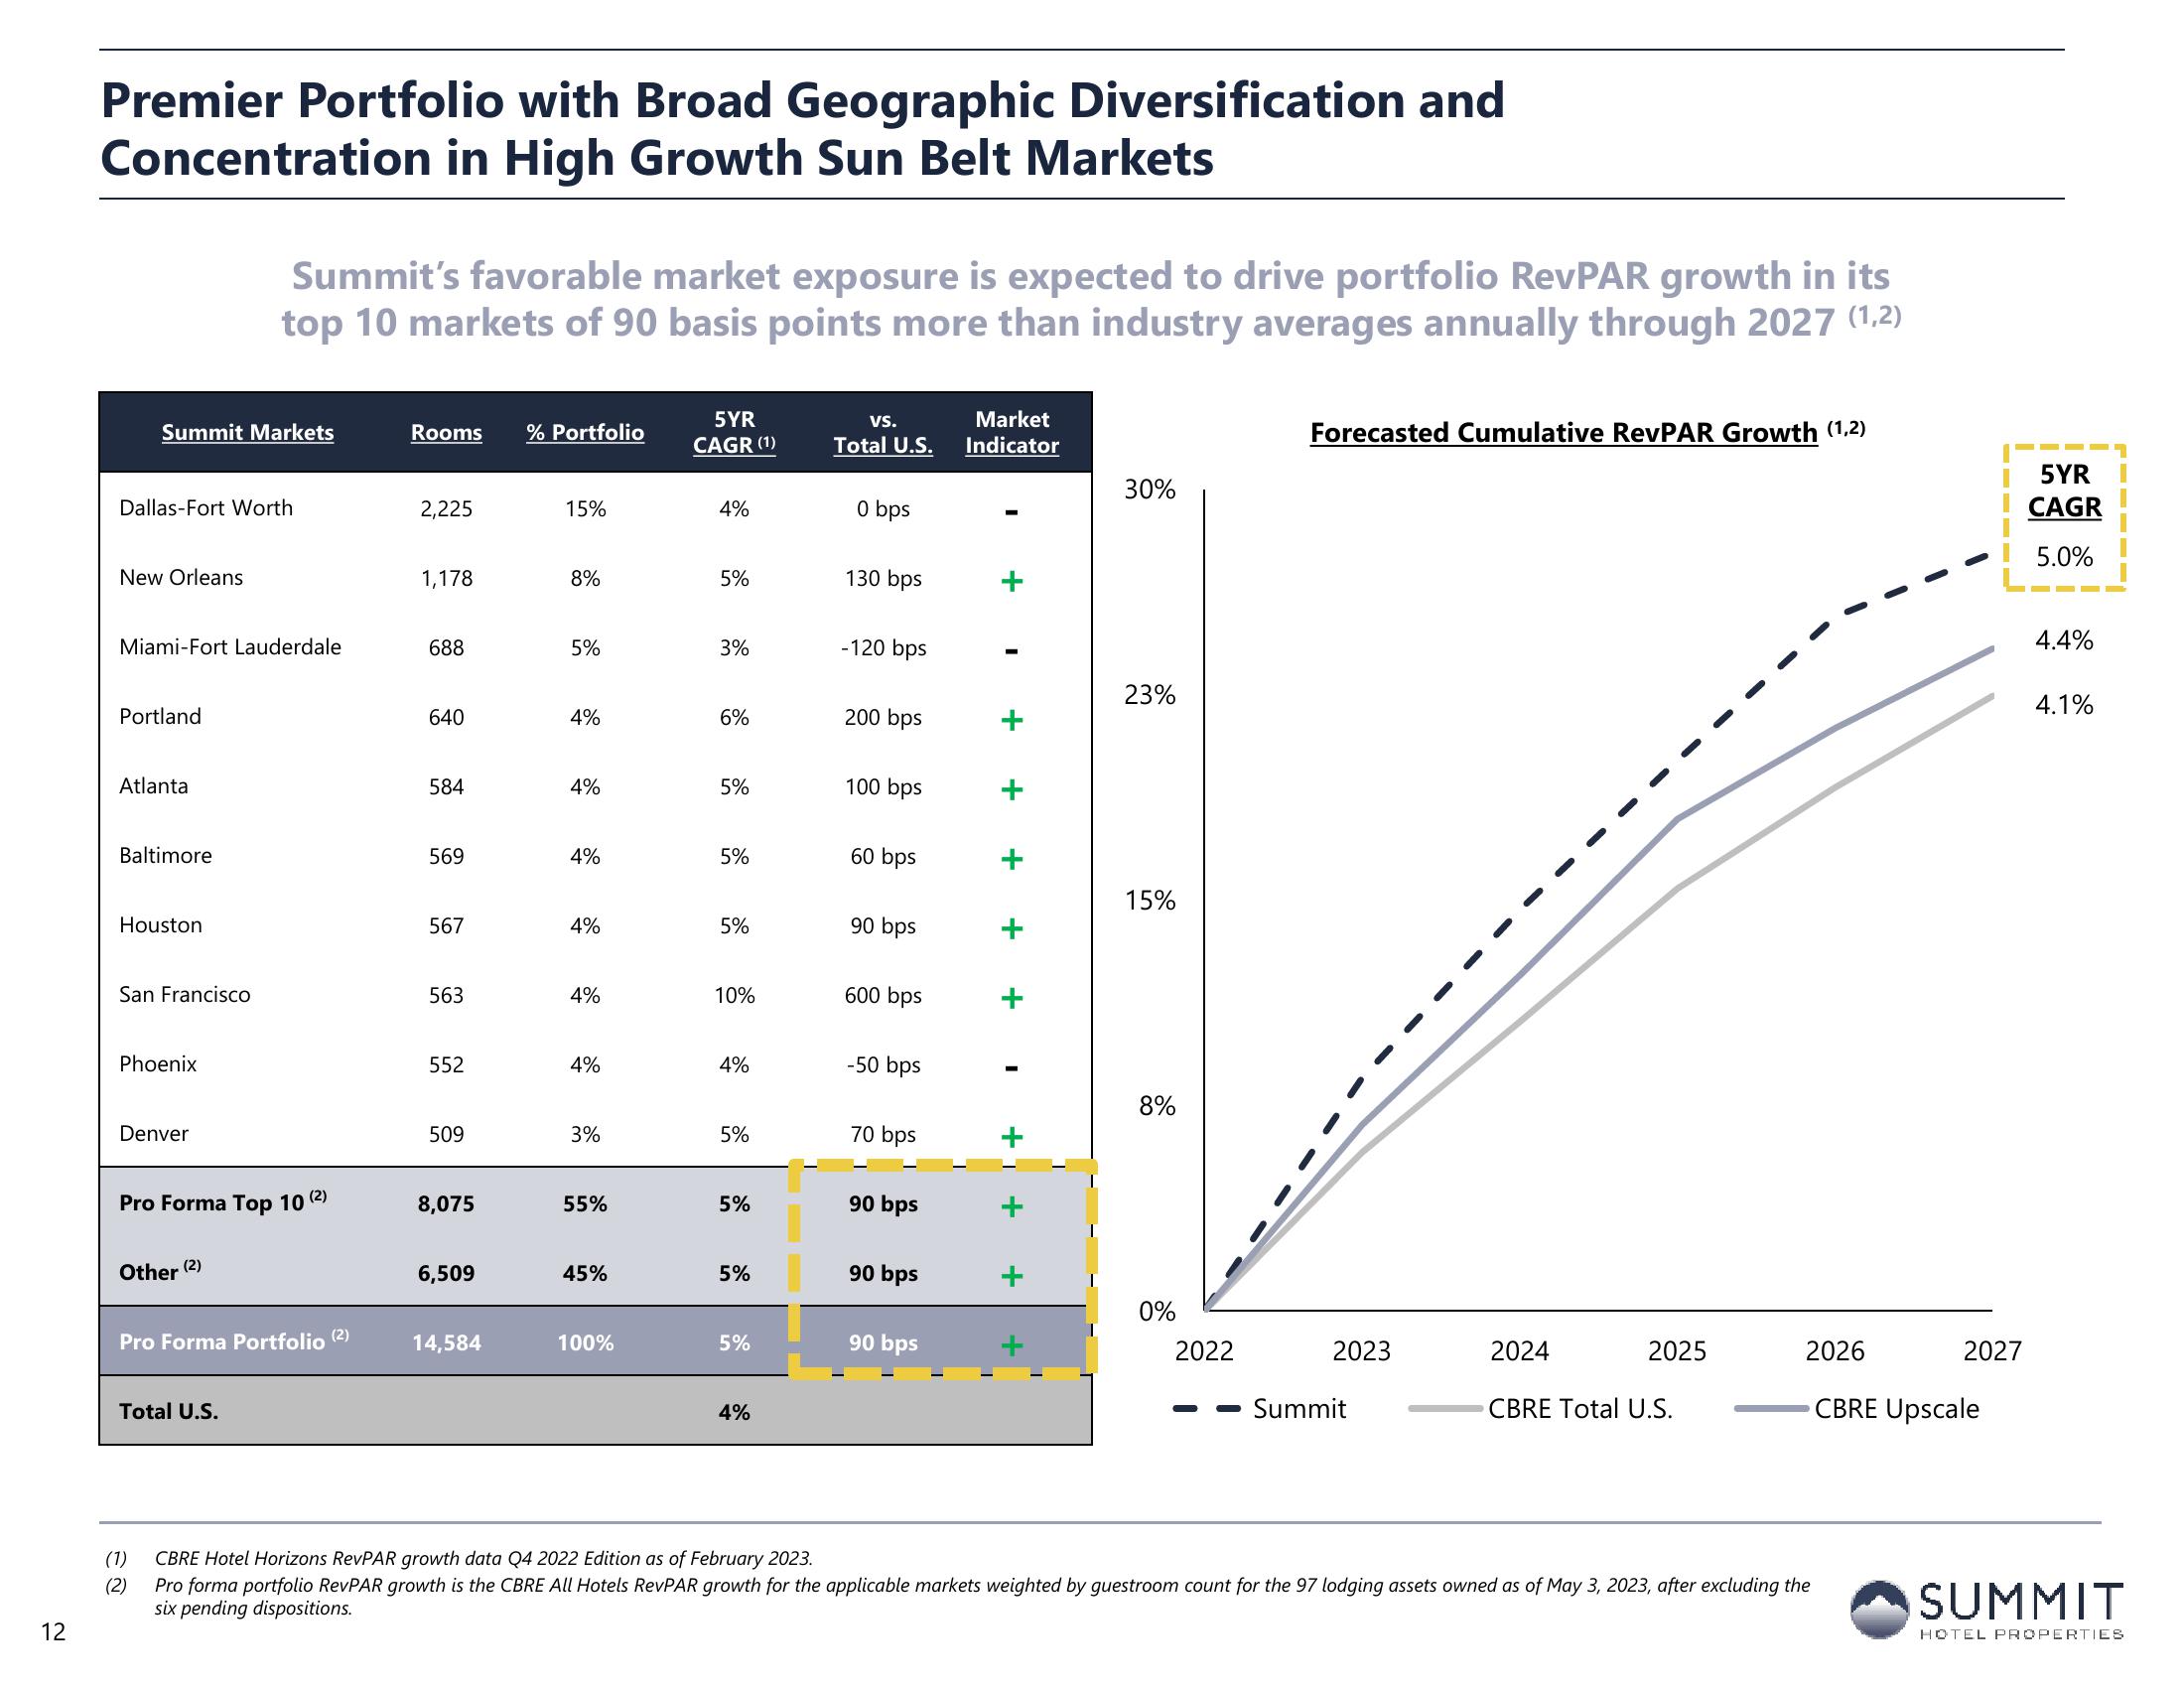
Summit's favorable market exposure is expected to drive portfolio RevPAR growth in its
top 10 markets of 90 basis points more than industry averages annually through 2027 (1,2)
Pro Forma Top 10 (²)
Other (2)
Pro Forma Portfolio (²)
Total U.S.
(1)
(2)
Rooms % Portfolio
2,225
1,178
688
640
584
569
567
563
552
509
8,075
6,509
14,584
15%
8%
5%
4%
4%
4%
4%
4%
4%
3%
55%
45%
100%
5YR
CAGR (1)
4%
5%
3%
6%
5%
5%
5%
10%
4%
5%
5%
5%
5%
4%
VS.
Total U.S.
0 bps
130 bps
-120 bps
200 bps
100 bps
60 bps
90 bps
600 bps
-50 bps
70 bps
90 bps
90 bps
90 bps
Market
Indicator
30%
23%
15%
8%
0%
2022
Forecasted Cumulative RevPAR Growth (1,2)
2023
Summit
2024
2025
CBRE Total U.S.
2026
CBRE Upscale
CBRE Hotel Horizons RevPAR growth data Q4 2022 Edition as of February 2023.
Pro forma portfolio RevPAR growth is the CBRE All Hotels RevPAR growth for the applicable markets weighted by guestroom count for the 97 lodging assets owned as of May 3, 2023, after excluding the
six pending dispositions.
‒‒‒
2027
5YR
CAGR
5.0%
4.4%
4.1%
SUMMIT
HOTEL PROPERTIESView entire presentation