Cheesecake Factory Investor Presentation Deck
$0.84
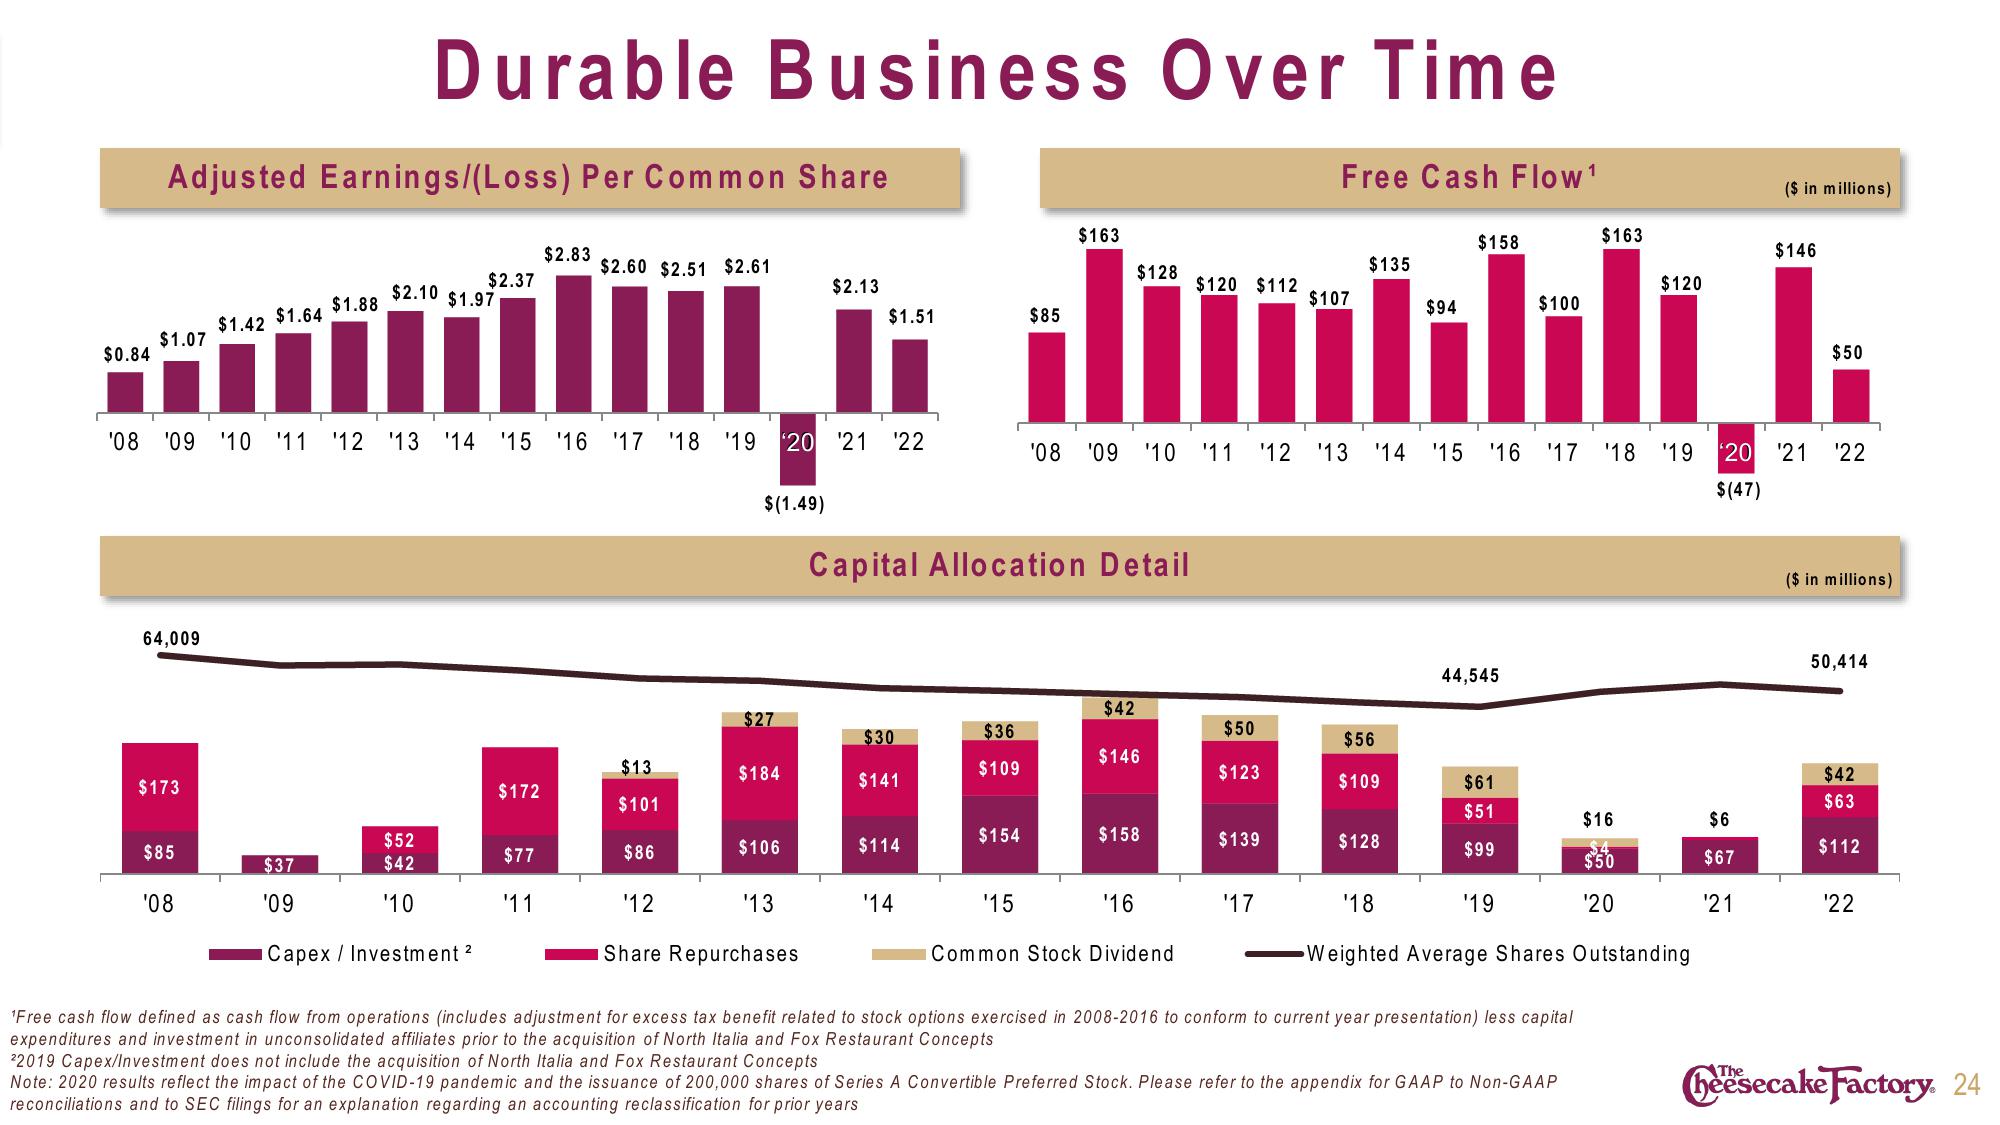
Adjusted Earnings/(Loss) Per Common Share
$1.07
64,009
$173
$1.42
$85
'08
$1.64
$1.88
$37
'09
Durable Business Over Time
$2.10
'08 ¹09 '10 11 '12 '13 '14 15 16 17 18 19 20 21 22
$52
$42
'10
$2.37
$1.97
Capex / Investment 2
$172
$2.83
$77
'11
$13
$101
$86
$158
$2.60 $2.51 $2.61
$135
$2.13
$107
$94
$100
$1.51
LG dimbllit.
'08 09 10 11 12 13 14 15 16 17 18 19 20 21 22
$(47)
$(1.49)
$27
$184
$106
'12
Share Repurchases
'13
$30
$141
Capital Allocation Detail
$114
'14
$36
$109
$154
$163
$85
'15
$128
$42
$146
$158
'16
Common Stock Dividend
$120 $112
$50
$123
$139
Free Cash Flow ¹
'17
$56
$109
$128
44,545
$61
$51
$99
'19
$163
Free cash flow defined as cash flow from operations (includes adjustment for excess tax benefit related to stock options exercised in 2008-2016 to conform to current year presentation) less capital
expenditures and investment in unconsolidated affiliates prior to the acquisition of North Italia and Fox Restaurant Concepts
22019 Capex/Investment does not include the acquisition of North Italia and Fox Restaurant Concepts
Note: 2020 results reflect the impact of the COVID-19 pandemic and the issuance of 200,000 shares of Series A Convertible Preferred Stock. Please refer to the appendix for GAAP to Non-GAAP
reconciliations and to SEC filings for an explanation regarding an accounting reclassification for prior years
$16
$50
'20
$120
'18
Weighted Average Shares Outstanding
($ in millions)
$6
$67
'21
$146
T
$50
($ in millions)
50,414
$42
$63
$112
7
'22
heesecake Factory. 24View entire presentation