OpenText Mergers and Acquisitions Presentation Deck
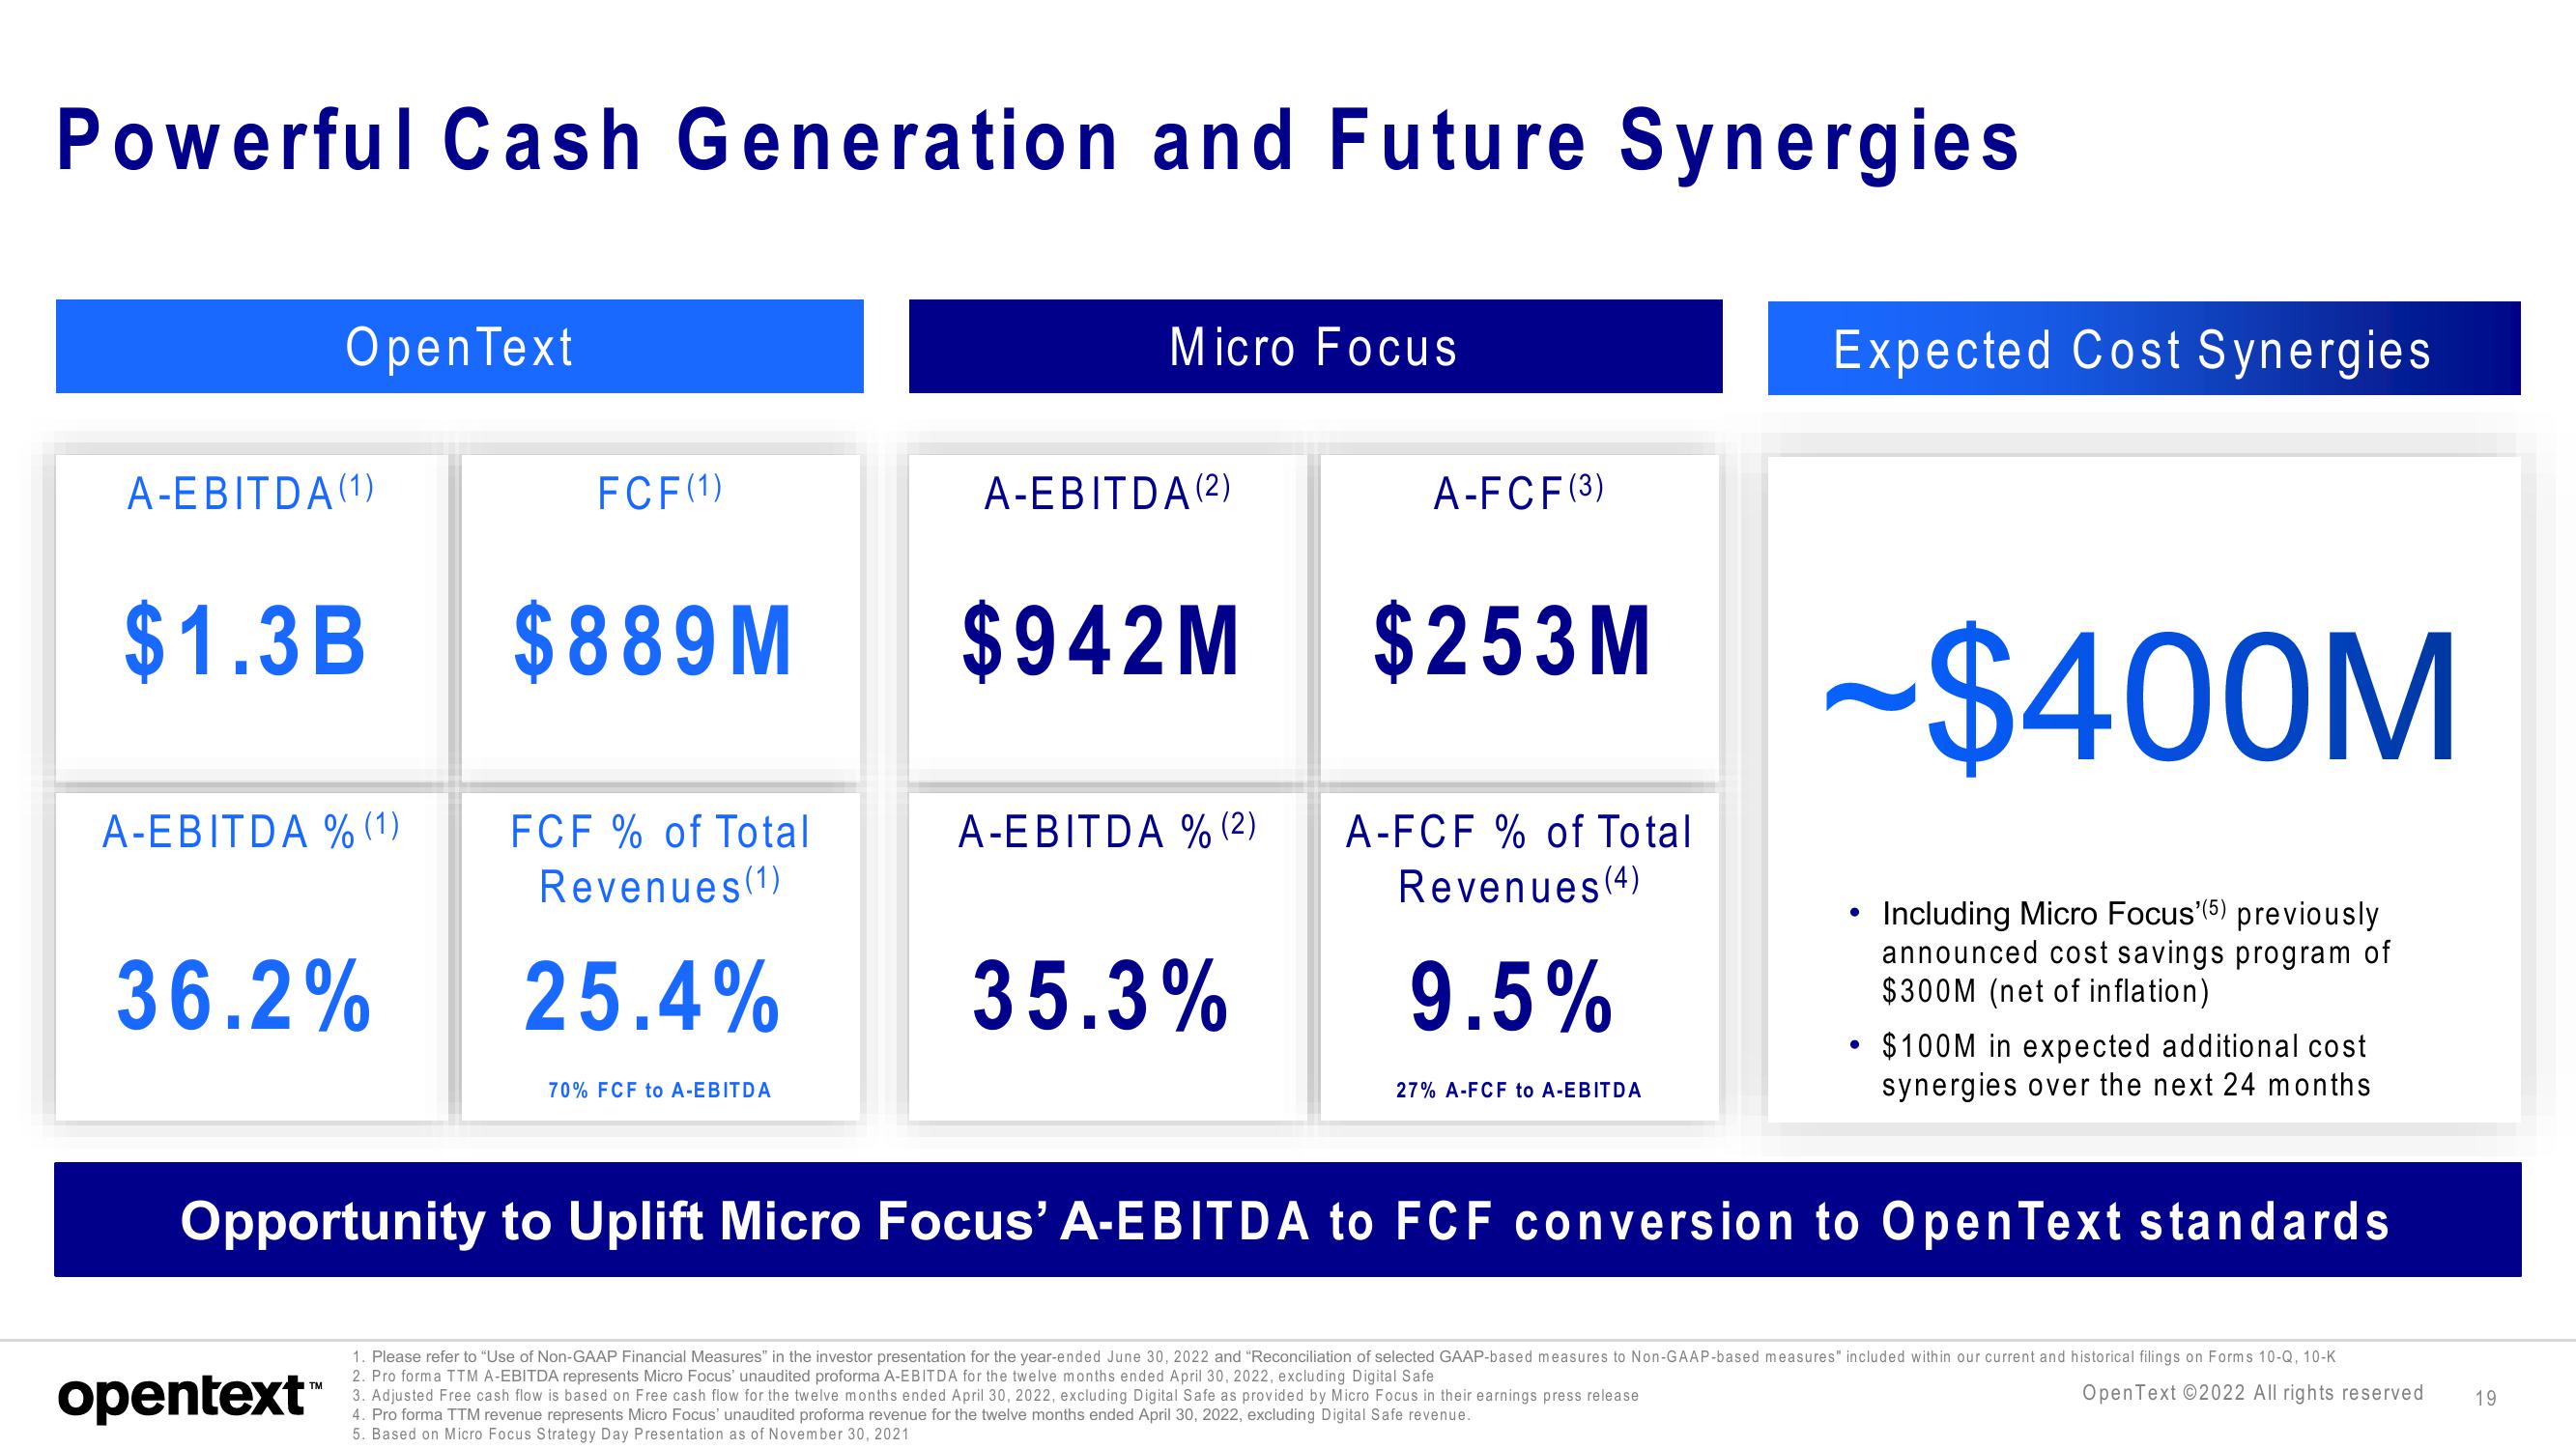
Powerful Cash Generation and Future Synergies
Open Text
A-EBITDA (1)
$1.3B
A-EBITDA % (1)
36.2%
opentext™
FCF (1)
$889M
FCF % of Total
Revenues (1)
25.4%
Micro Focus
70% FCF to A-EBITDA
A-EBITDA (2)
$942M
A-EBITDA % (2)
35.3%
A-FCF (3)
$253M
A-FCF % of Total
Revenues (4)
9.5%
• $100M in expected additional cost
synergies over the next 24 months
Opportunity to Uplift Micro Focus' A-EBITDA to FCF conversion to Open Text standards
27% A-FCF to A-EBITDA
Expected Cost Synergies.
-$400M
Including Micro Focus'(5) previously
announced cost savings program of
$300M (net of inflation)
3. Adjusted Free cash flow is based on Free cash flow for the twelve months ended April 30, 2022, excluding Digital Safe as provided by Micro Focus in their earnings press release
4. Pro forma TTM revenue represents Micro Focus' unaudited proforma revenue for the twelve months ended April 30, 2022, excluding Digital Safe revenue.
5. Based on Micro Focus Strategy Day Presentation as of November 30, 2021
●
1. Please refer to "Use of Non-GAAP Financial Measures" in the investor presentation for the year-ended June 30, 2022 and "Reconciliation of selected GAAP-based measures to Non-GAAP-based measures" included within our current and historical filings on Forms 10-Q, 10-K
2. Pro forma TTM A-EBITDA represents Micro Focus' unaudited proforma A-EBITDA for the twelve months ended April 30, 2022, excluding Digital Safe
OpenText ©2022 All rights reserved
19View entire presentation