AES Panama Investor Presentation
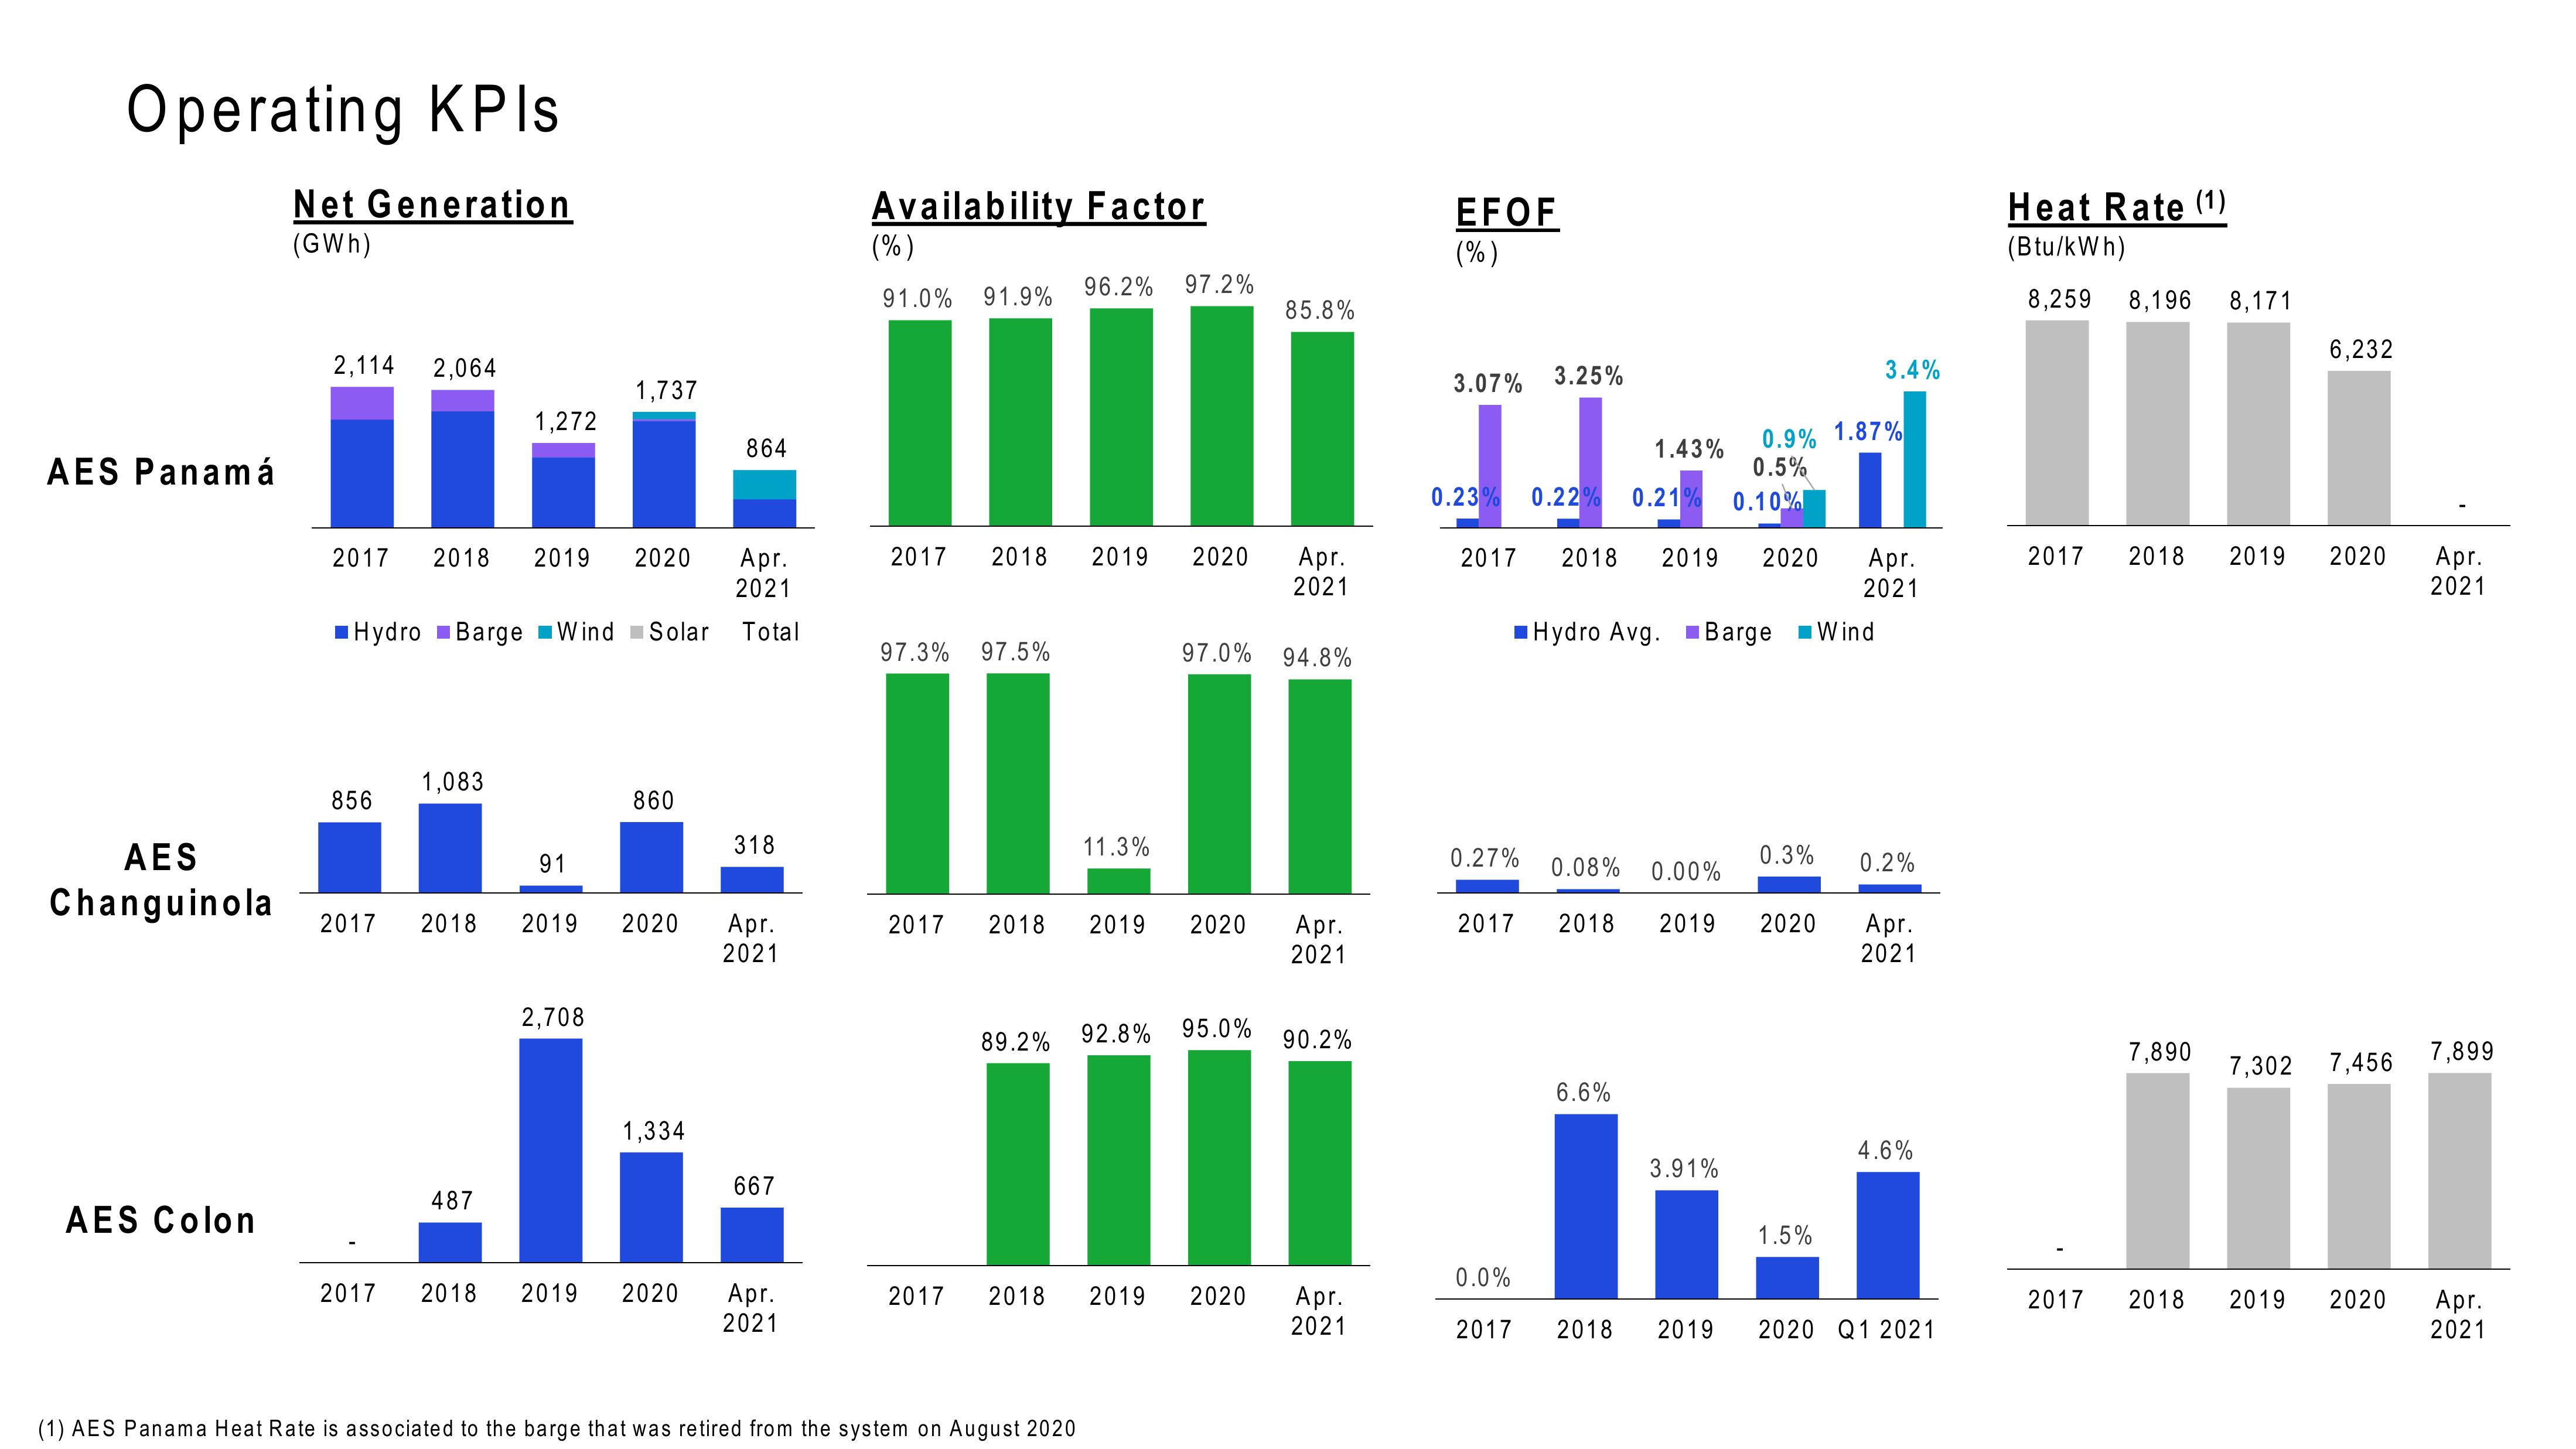
Operating KPIs
Net Generation
(GWh)
Availability Factor
EFOF
Heat Rate (1)
(%)
(%)
(Btu/kWh)
91.0% 91.9%
96.2% 97.2%
85.8%
8,259 8,196 8,171
6,232
2,114 2,064
1,737
1,272
864
3.07%
3.25%
3.4%
AES Panamá
1.43%
0.23 0.22% 0.21% 0.10%
0.9% 1.87%
0.5%
2017 2018 2019 2020
Apr.
2021
2017 2018 2019 2020 Apr.
2017
2021
2018 2019 2020 Apr.
2021
2017 2018 2019 2020 Apr.
2021
Hydro Barge Wind Solar Total
Hydro Avg. Barge Wind
97.3% 97.5%
97.0% 94.8%
1,083
856
AES
Changuinola 2017 2018 2019
AES Colon
487
860
318
11.3%
91
0.27%
2020
Apr.
2017 2018
2019 2020
Apr.
2021
2021
0.08% 0.00%
2017 2018 2019 2020 Apr.
2021
0.3%
0.2%
2,708
89.2%
92.8% 95.0%
90.2%
6.6%
1,334
667
4.6%
3.91%
1.5%
7,890
7,899
7,302 7,456
0.0%
2017
2018 2019 2020
Apr.
2017
2018
2019 2020
Apr.
2017
2018
2021
2021
2017
2018 2019
2020 Q1 2021
2019 2020 Apr.
2021
(1) AES Panama Heat Rate is associated to the barge that was retired from the system on August 2020View entire presentation