MoneyLion Investor Conference Presentation Deck
Segment Revenue and Adjusted Net Income
Core and emerging businesses driving growth and profitability
(in millions)
Adjusted Revenue by Type
Fees
Payments
Advice
Interest
Adjusted Revenue (1)
Adjusted Gross Profit (2)
Adjusted Net Income (6)
Total Originations (4)
Provision as % of Originations (7)
Q1 2020
$11.5
1.5
0.7
0.8
$14.4
$5.0
($6.8)
$62.0
4.9%
FY 2020
Q2 2020
$13.6
1.6
0.6
1.2
$17.0
$8.7
$1.1
$76.7
(0.6%)
Q3 2020
$15.4
1.4
0.7
1.6
$19.2
23
$10.6
($5.7)
$116.7
5.7%
Q4 2020
$20.5
2.1
1.4
1.5
$25.5
$14.2
($11.8)
$154.9
5.7%
Q1 2021
$25.5
3.8
1.3
1.9
$32.5
$19.4
($2.3)
$188.7
2.6%
FY 2021
Q2 2021
$28.0
3.7
2.5
2.3
$36.4
$22.3
($12.0)
$237.1
5.7%
Q3 2021
$32.8
3.0
3.4
2.8
$42.0
$27.0
($20.3)
$274.2
4.6%
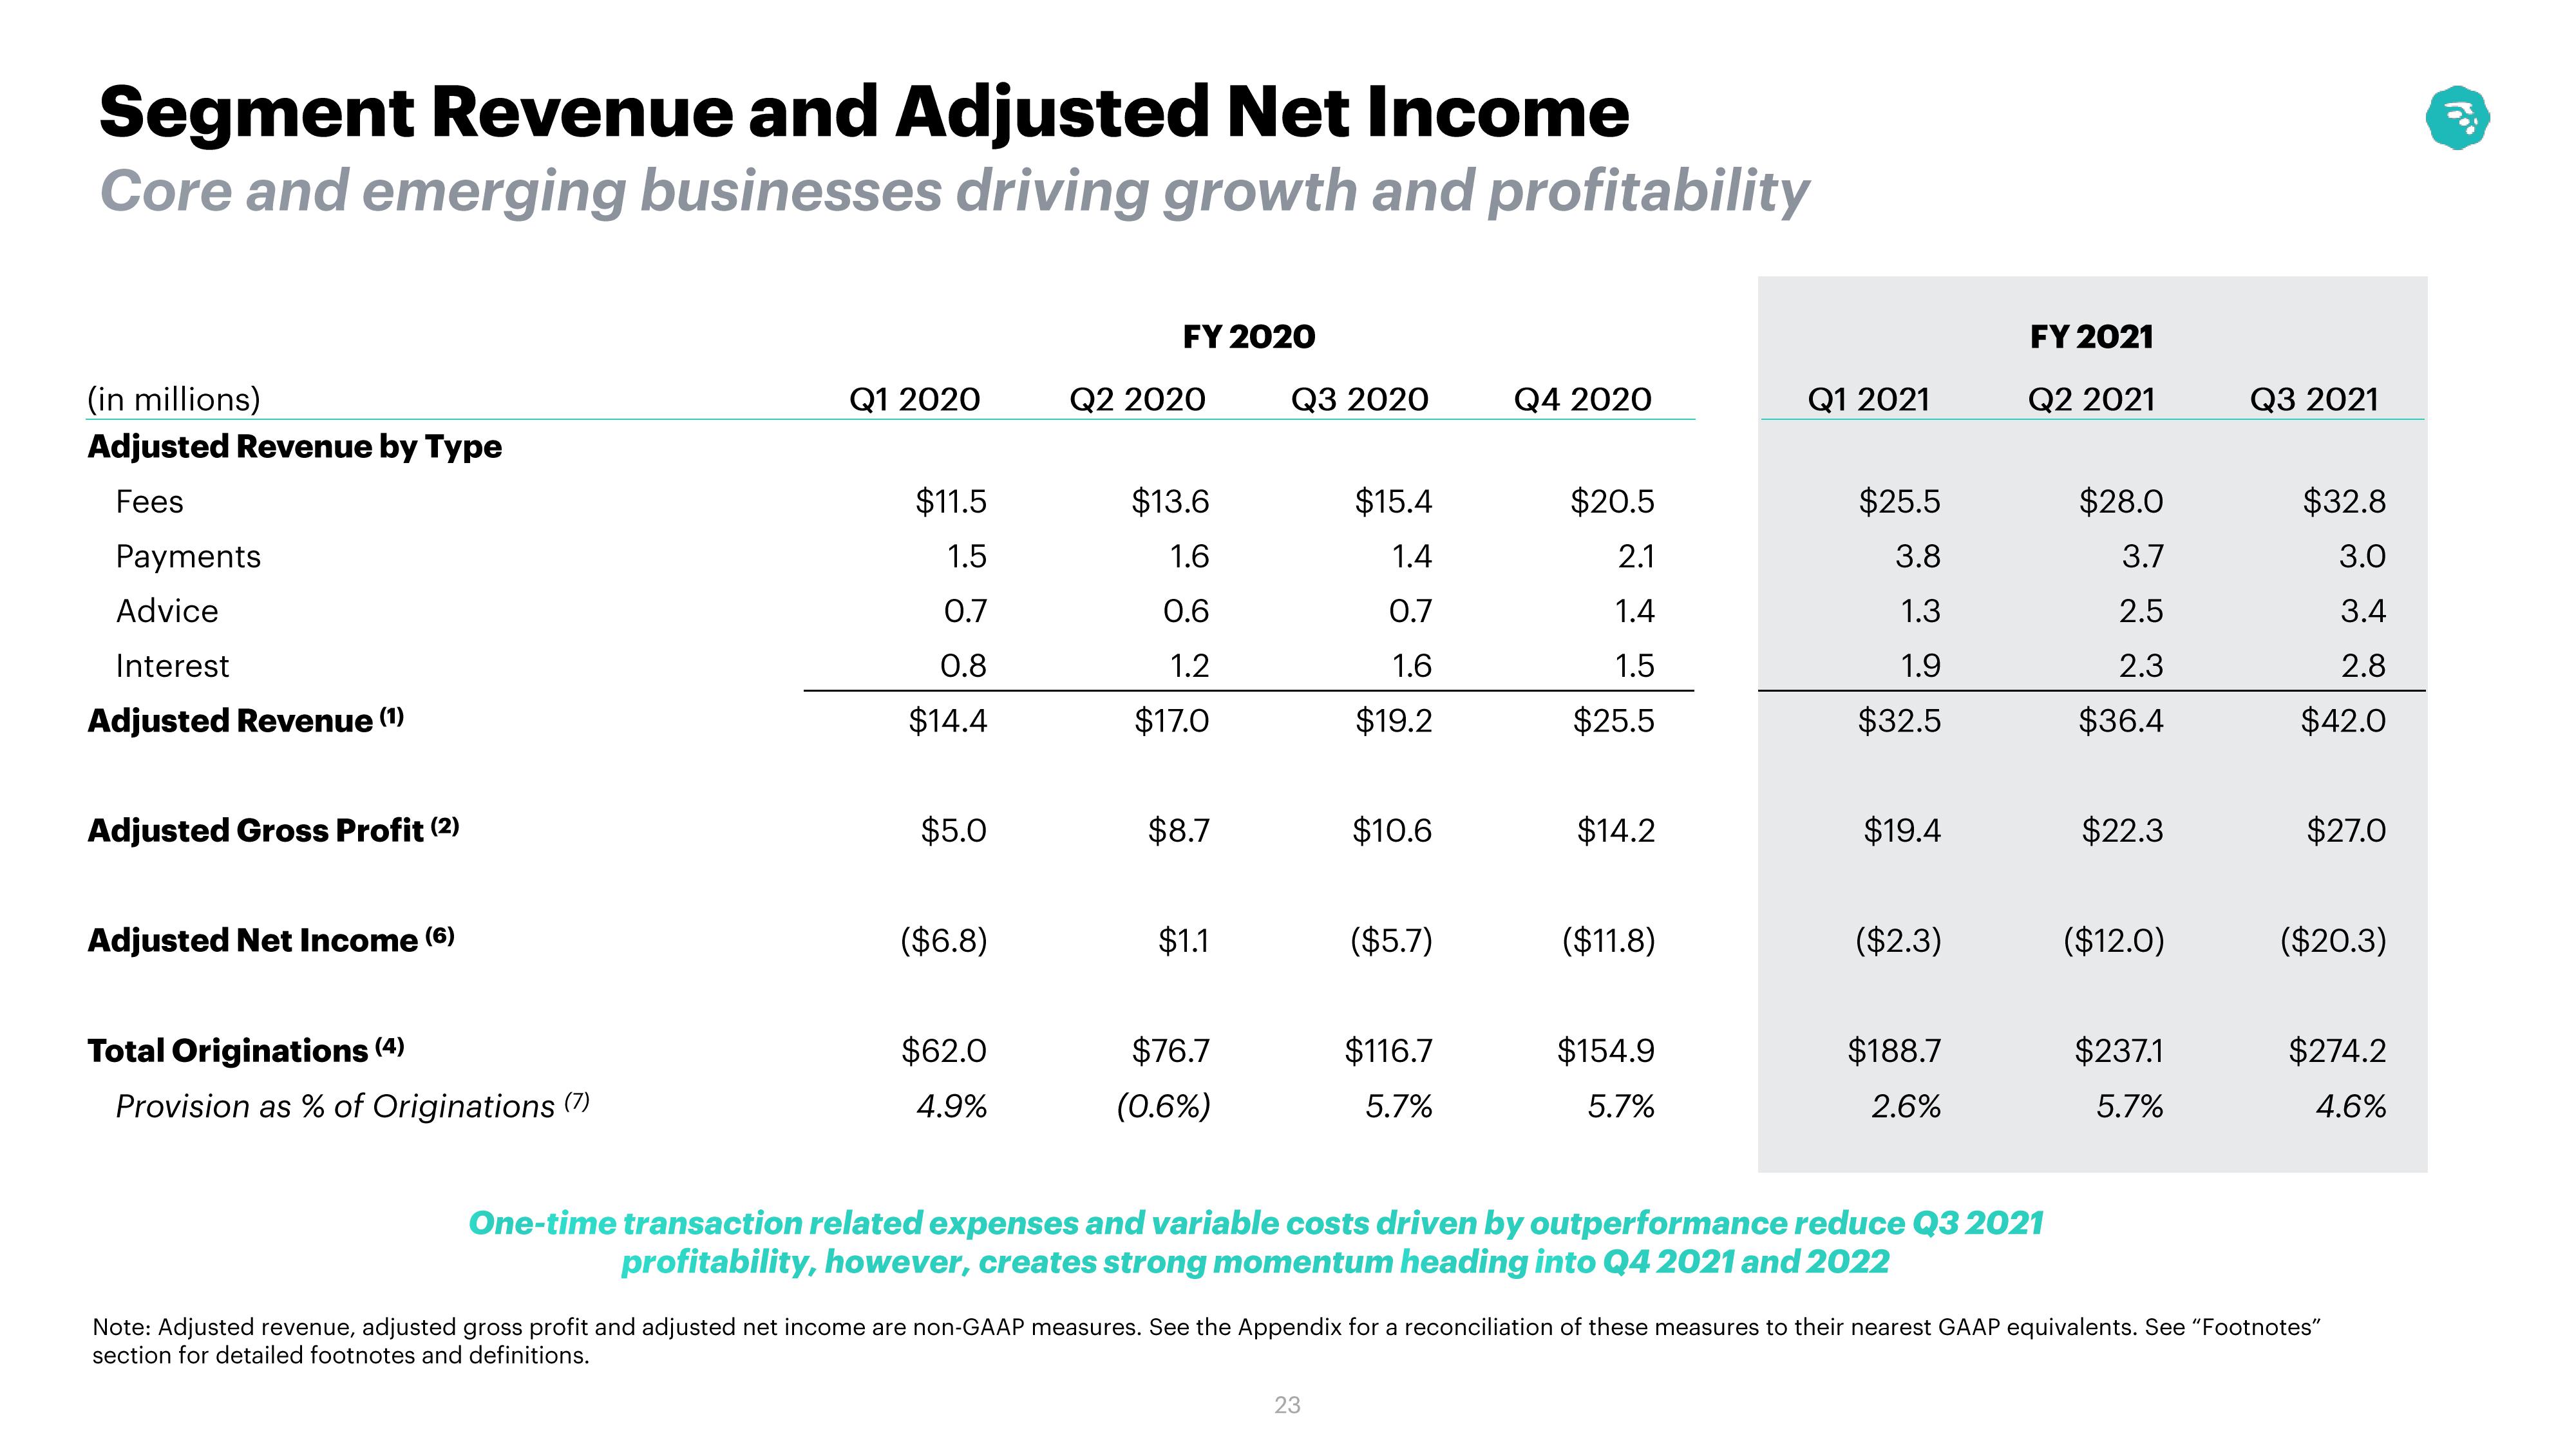
One-time transaction related expenses and variable costs driven by outperformance reduce Q3 2021
profitability, however, creates strong momentum heading into Q4 2021 and 2022
Note: Adjusted revenue, adjusted gross profit and adjusted net income are non-GAAP measures. See the Appendix for a reconciliation of these measures to their nearest GAAP equivalents. See "Footnotes"
section for detailed footnotes and definitions.
10⁰View entire presentation