Selina SPAC
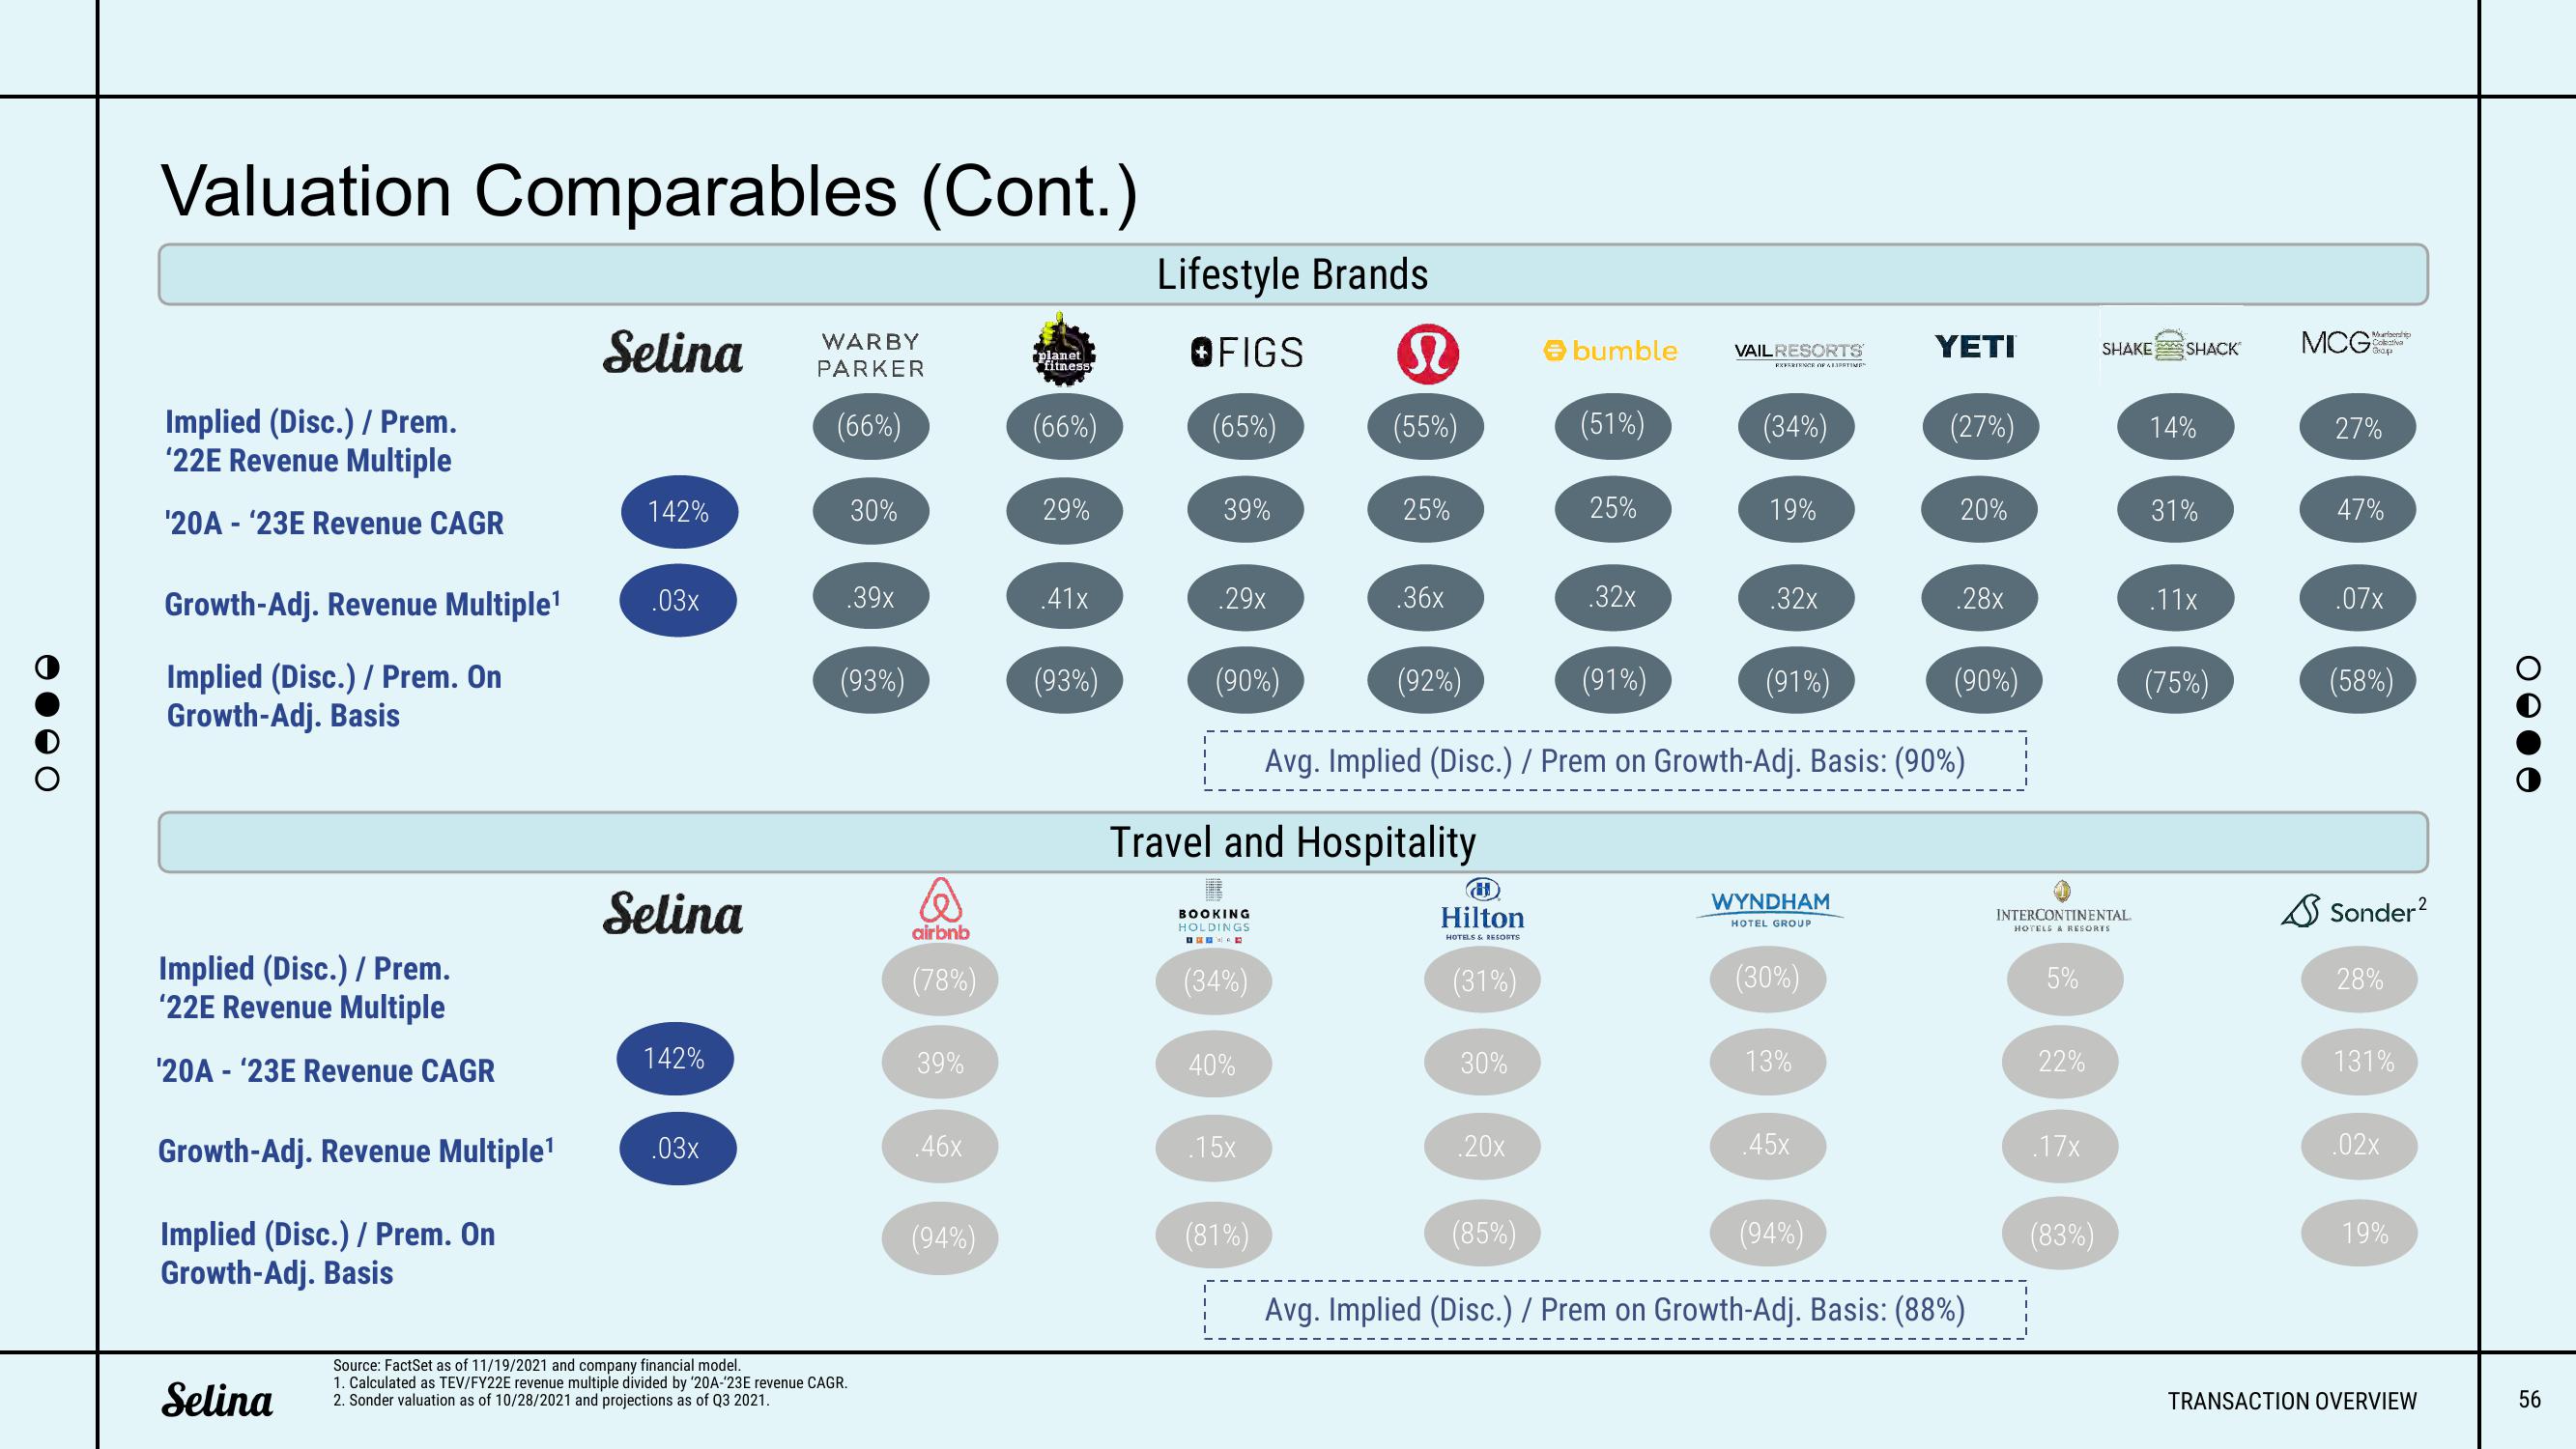
Valuation Comparables (Cont.)
Implied (Disc.) / Prem.
'22E Revenue Multiple
'20A- '23E Revenue CAGR
Growth-Adj. Revenue Multiple¹
Implied (Disc.) / Prem. On
Growth-Adj. Basis
Implied (Disc.) / Prem.
'22E Revenue Multiple
'20A - ¹23E Revenue CAGR
Growth-Adj. Revenue Multiple¹
Implied (Disc.) / Prem. On
Growth-Adj. Basis
Selina
Selina
142%
.03x
Selina
142%
.03x
WARBY
PARKER
(66%)
30%
.39x
(93%)
Source: FactSet as of 11/19/2021 and company financial model.
1. Calculated as TEV/FY22E revenue multiple divided by '20A-'23E revenue CAGR.
2. Sonder valuation as of 10/28/2021 and projections as of Q3 2021.
@
airbnb
(78%)
39%
.46x
(94%)
planet
fitness
(66%)
29%
.41x
(93%)
Lifestyle Brands
OFIGS
(65%)
39%
.29x
(90%)
BOOKING
HOLDINGS
BED
(34%)
40%
.15x
n
(55%)
(81%)
25%
Travel and Hospitality
.36x
(92%)
H
Hilton
HOTELS & RESORTS
(31%)
30%
> bumble
.20x
(51%)
25%
.32x
VAIL RESORTS
EXPERIENCE OF ALAPRTIMES
(34%)
19%
(91%)
Avg. Implied (Disc.) / Prem on Growth-Adj. Basis: (90%)
32x
(91%)
WYNDHAM
HOTEL GROUP
(30%)
13%
.45x
YETI
(27%)
(94%)
20%
.28x
(90%)
(85%)
Avg. Implied (Disc.) / Prem on Growth-Adj. Basis: (88%)
INTERCONTINENTAL
HOTELS & RESORTS
5%
22%
.17x
SHAKE SHACK
(83%)
14%
31%
.11x
(75%)
MCG
Marlbership
Colectiva
Grap
27%
47%
.07x
(58%)
Sonder²
28%
131%
.02x
19%
TRANSACTION OVERVIEW
56View entire presentation