DraftKings Investor Day Presentation Deck
B
Gross margins improving across states due to scale and vertical integration
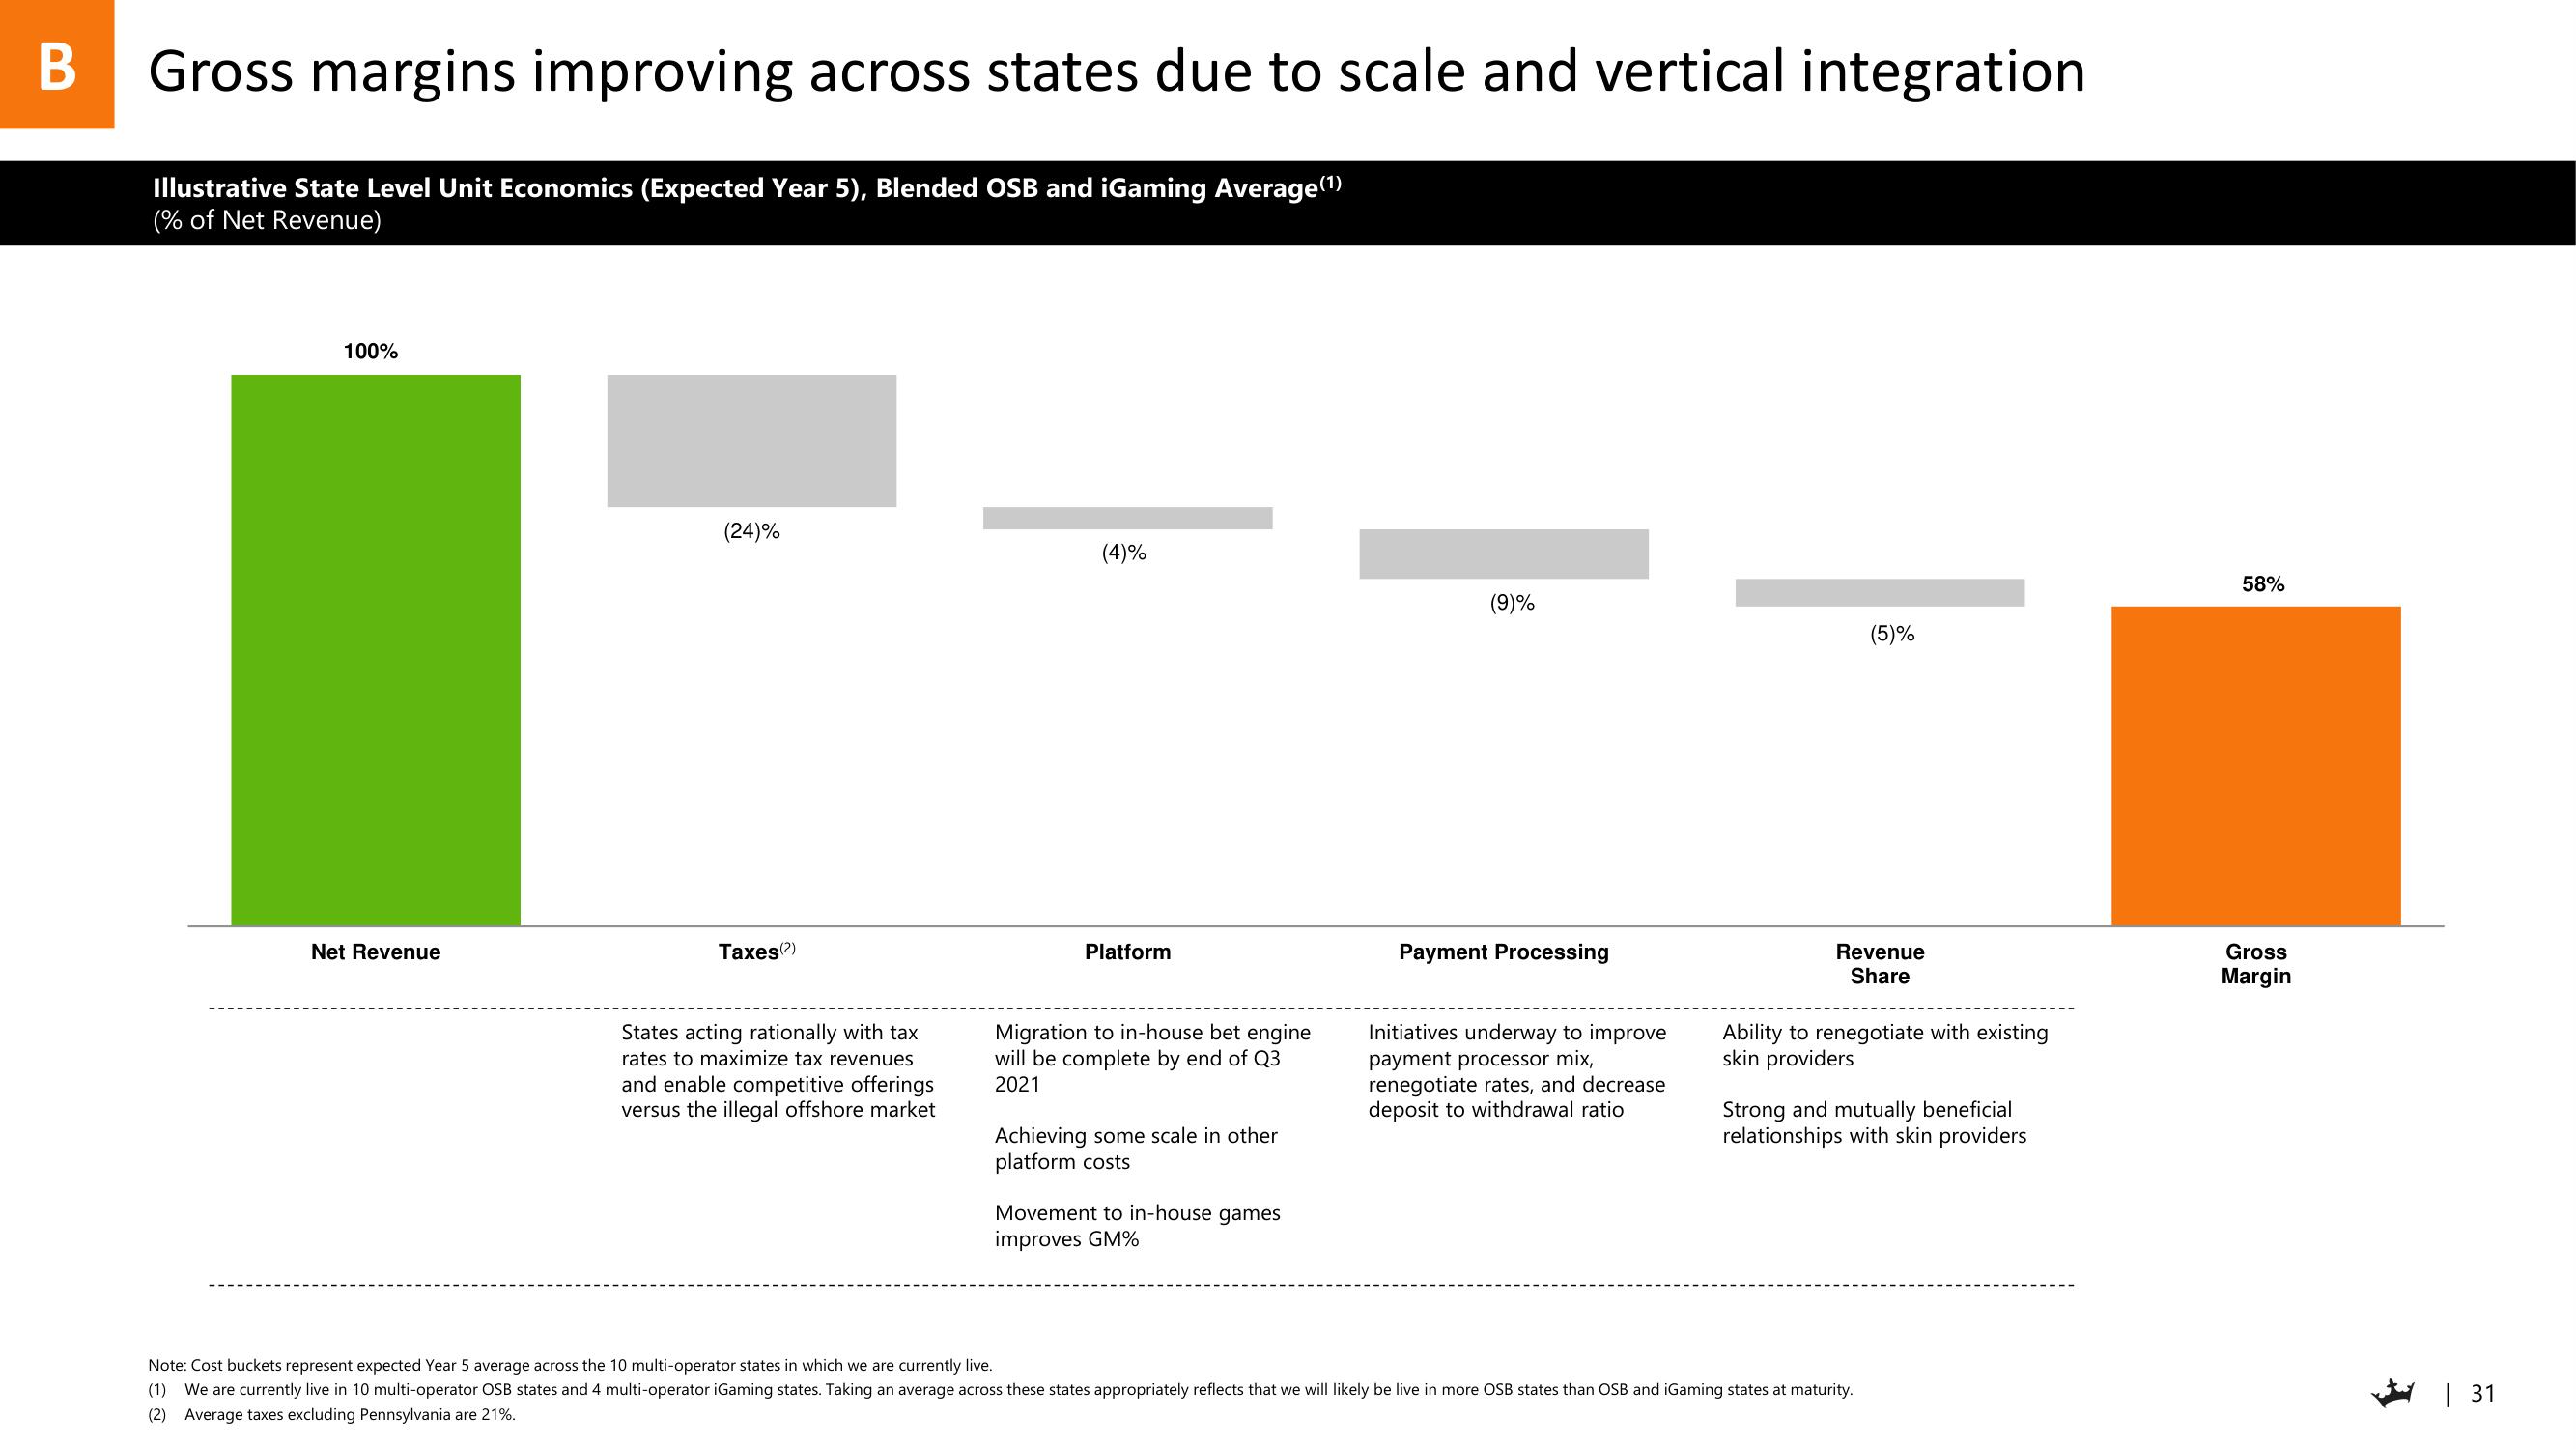
Illustrative State Level Unit Economics (Expected Year 5), Blended OSB and iGaming Average (¹)
(% of Net Revenue)
100%
Net Revenue
(24)%
Taxes (2)
States acting rationally with tax
rates to maximize tax revenues
and enable competitive offerings
versus the illegal offshore market
(4)%
Platform
Migration to in-house bet engine
will be complete by end of Q3
2021
Achieving some scale in other
platform costs
Movement to in-house games
improves GM%
(9)%
Payment Processing
Initiatives underway to improve
payment processor mix,
renegotiate rates, and decrease
deposit to withdrawal ratio
(5)%
Revenue
Share
Ability to renegotiate with existing
skin providers
Strong and mutually beneficial
relationships with skin providers
Note: Cost buckets represent expected Year 5 average across the 10 multi-operator states in which we are currently live.
(1) We are currently live in 10 multi-operator OSB states and 4 multi-operator iGaming states. Taking an average across these states appropriately reflects that we will likely be live in more OSB states than OSB and iGaming states at maturity.
(2) Average taxes excluding Pennsylvania are 21%.
58%
Gross
Margin
| 31View entire presentation