Credit Suisse Results Presentation Deck
Investment Bank
Significant pre-tax loss amid extremely challenging market conditions
Adjusted key financials
Key
metrics
21
in USD mn
Fixed income sales & trading
Equity sales & trading¹
Capital markets
Advisory and other fees
Other²
Net revenues
Provision for credit losses
Total operating expenses
Adjusted PTI
Adjusted C/I ratio
Adjusted RoRCt
Reported PTI
Reported RORC+
in USD bn
Risk-weighted assets
Leverage exposure
2Q22
622
342
38
190
(42)
1,150
57
1,953
(860)
170%
(19)%
(1,165)
(26)%
86
349
1Q22
802
526
466
221
5
2,020
(2)
2,077
(55)
103%
(1)%
134
3%
93
364
2Q21
916
509
1,000
139
(5)
2,559
(56)
1,952
663
76%
12%
(22)
96
409
Δ 2021
(32)%
(33)%
(96)%
37%
(55)%
0%
n/m
n/m
(11)%
(15)%
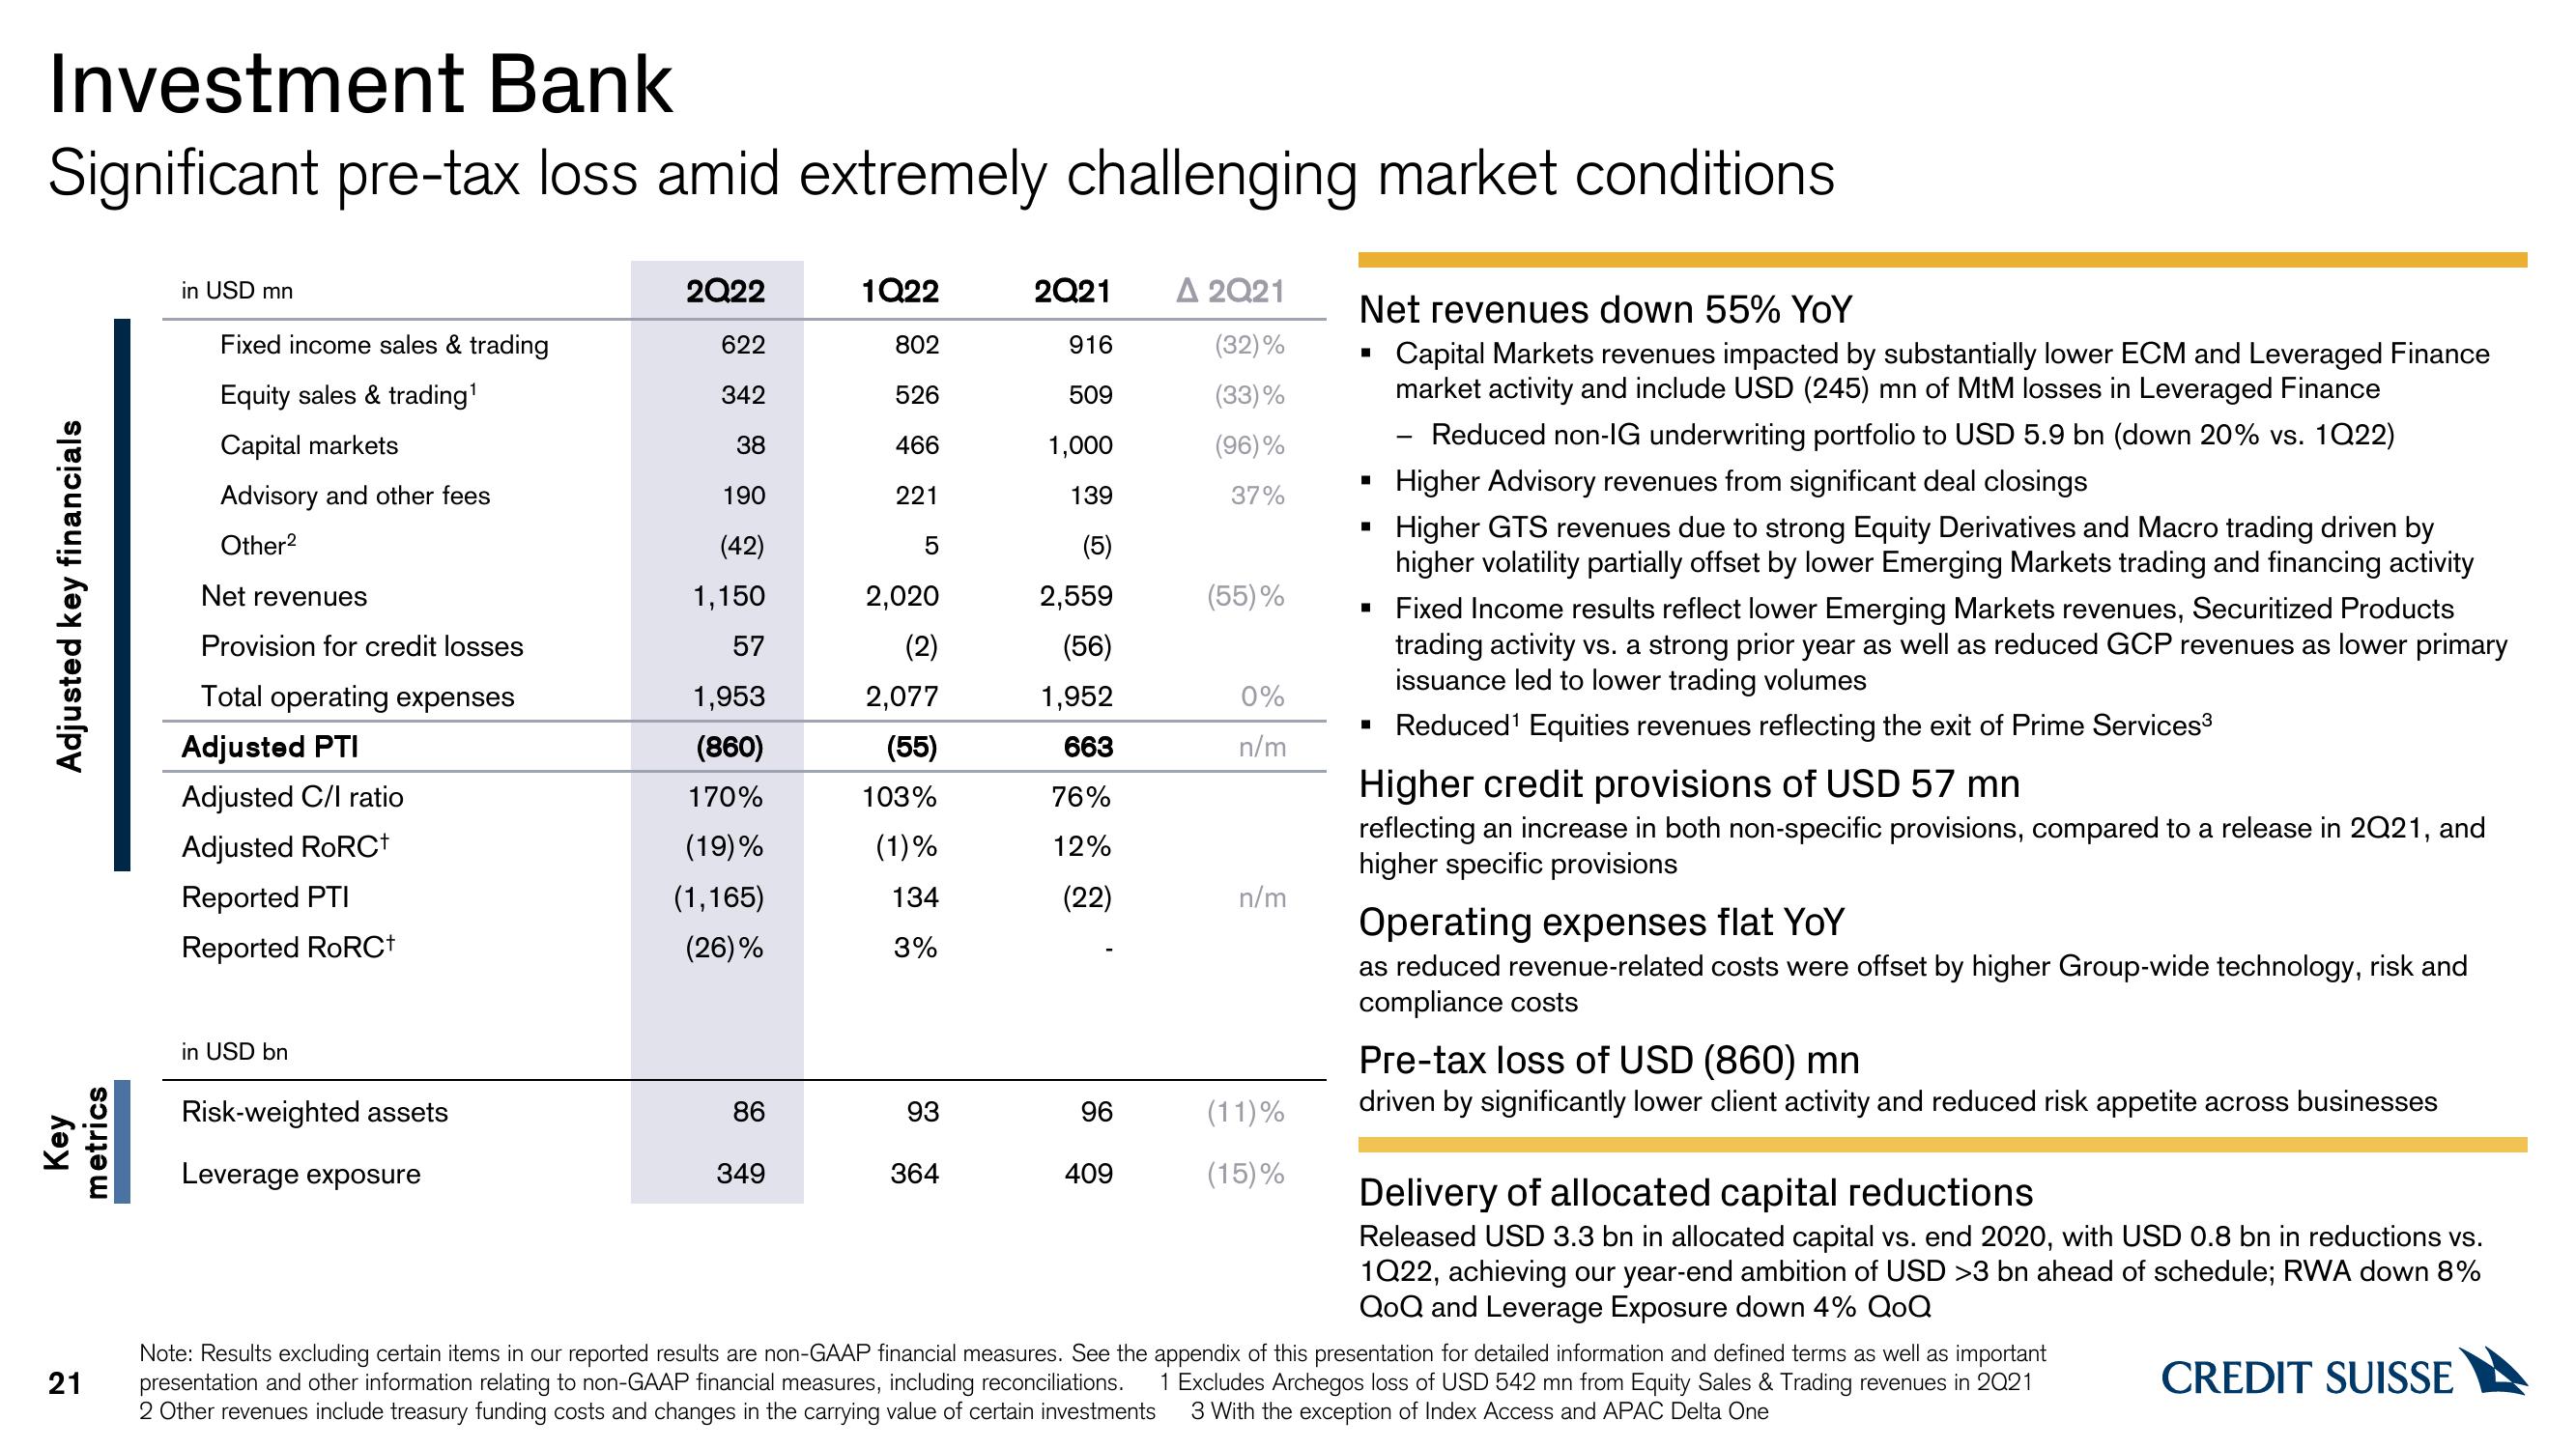
Net revenues down 55% YoY
Capital Markets revenues impacted by substantially lower ECM and Leveraged Finance
market activity and include USD (245) mn of MtM losses in Leveraged Finance
Reduced non-IG underwriting portfolio to USD 5.9 bn (down 20% vs. 1022)
▪ Higher Advisory revenues from significant deal closings
Higher GTS revenues due to strong Equity Derivatives and Macro trading driven by
higher volatility partially offset by lower Emerging Markets trading and financing activity
Fixed Income results reflect lower Emerging Markets revenues, Securitized Products
trading activity vs. a strong prior year as well as reduced GCP revenues as lower primary
issuance led to lower trading volumes
Reduced¹ Equities revenues reflecting the exit of Prime Services³
■
Higher credit provisions of USD 57 mn
reflecting an increase in both non-specific provisions, compared to a release in 2Q21, and
higher specific provisions
Operating expenses flat YoY
as reduced revenue-related costs were offset by higher Group-wide technology, risk and
compliance costs
Pre-tax loss of USD (860) mn
driven by significantly lower client activity and reduced risk appetite across businesses
Delivery of allocated capital reductions
Released USD 3.3 bn in allocated capital vs. end 2020, with USD 0.8 bn in reductions vs.
1Q22, achieving our year-end ambition of USD >3 bn ahead of schedule; RWA down 8%
QoQ and Leverage Exposure down 4% QOQ
Note: Results excluding certain items in our reported results are non-GAAP financial measures. See the appendix of this presentation for detailed information and defined terms as well as important
presentation and other information relating to non-GAAP financial measures, including reconciliations. 1 Excludes Archegos loss of USD 542 mn from Equity Sales & Trading revenues in 2021
2 Other revenues include treasury funding costs and changes in the carrying value of certain investments 3 With the exception of Index Access and APAC Delta One
CREDIT SUISSEView entire presentation