Cboe Results Presentation Deck
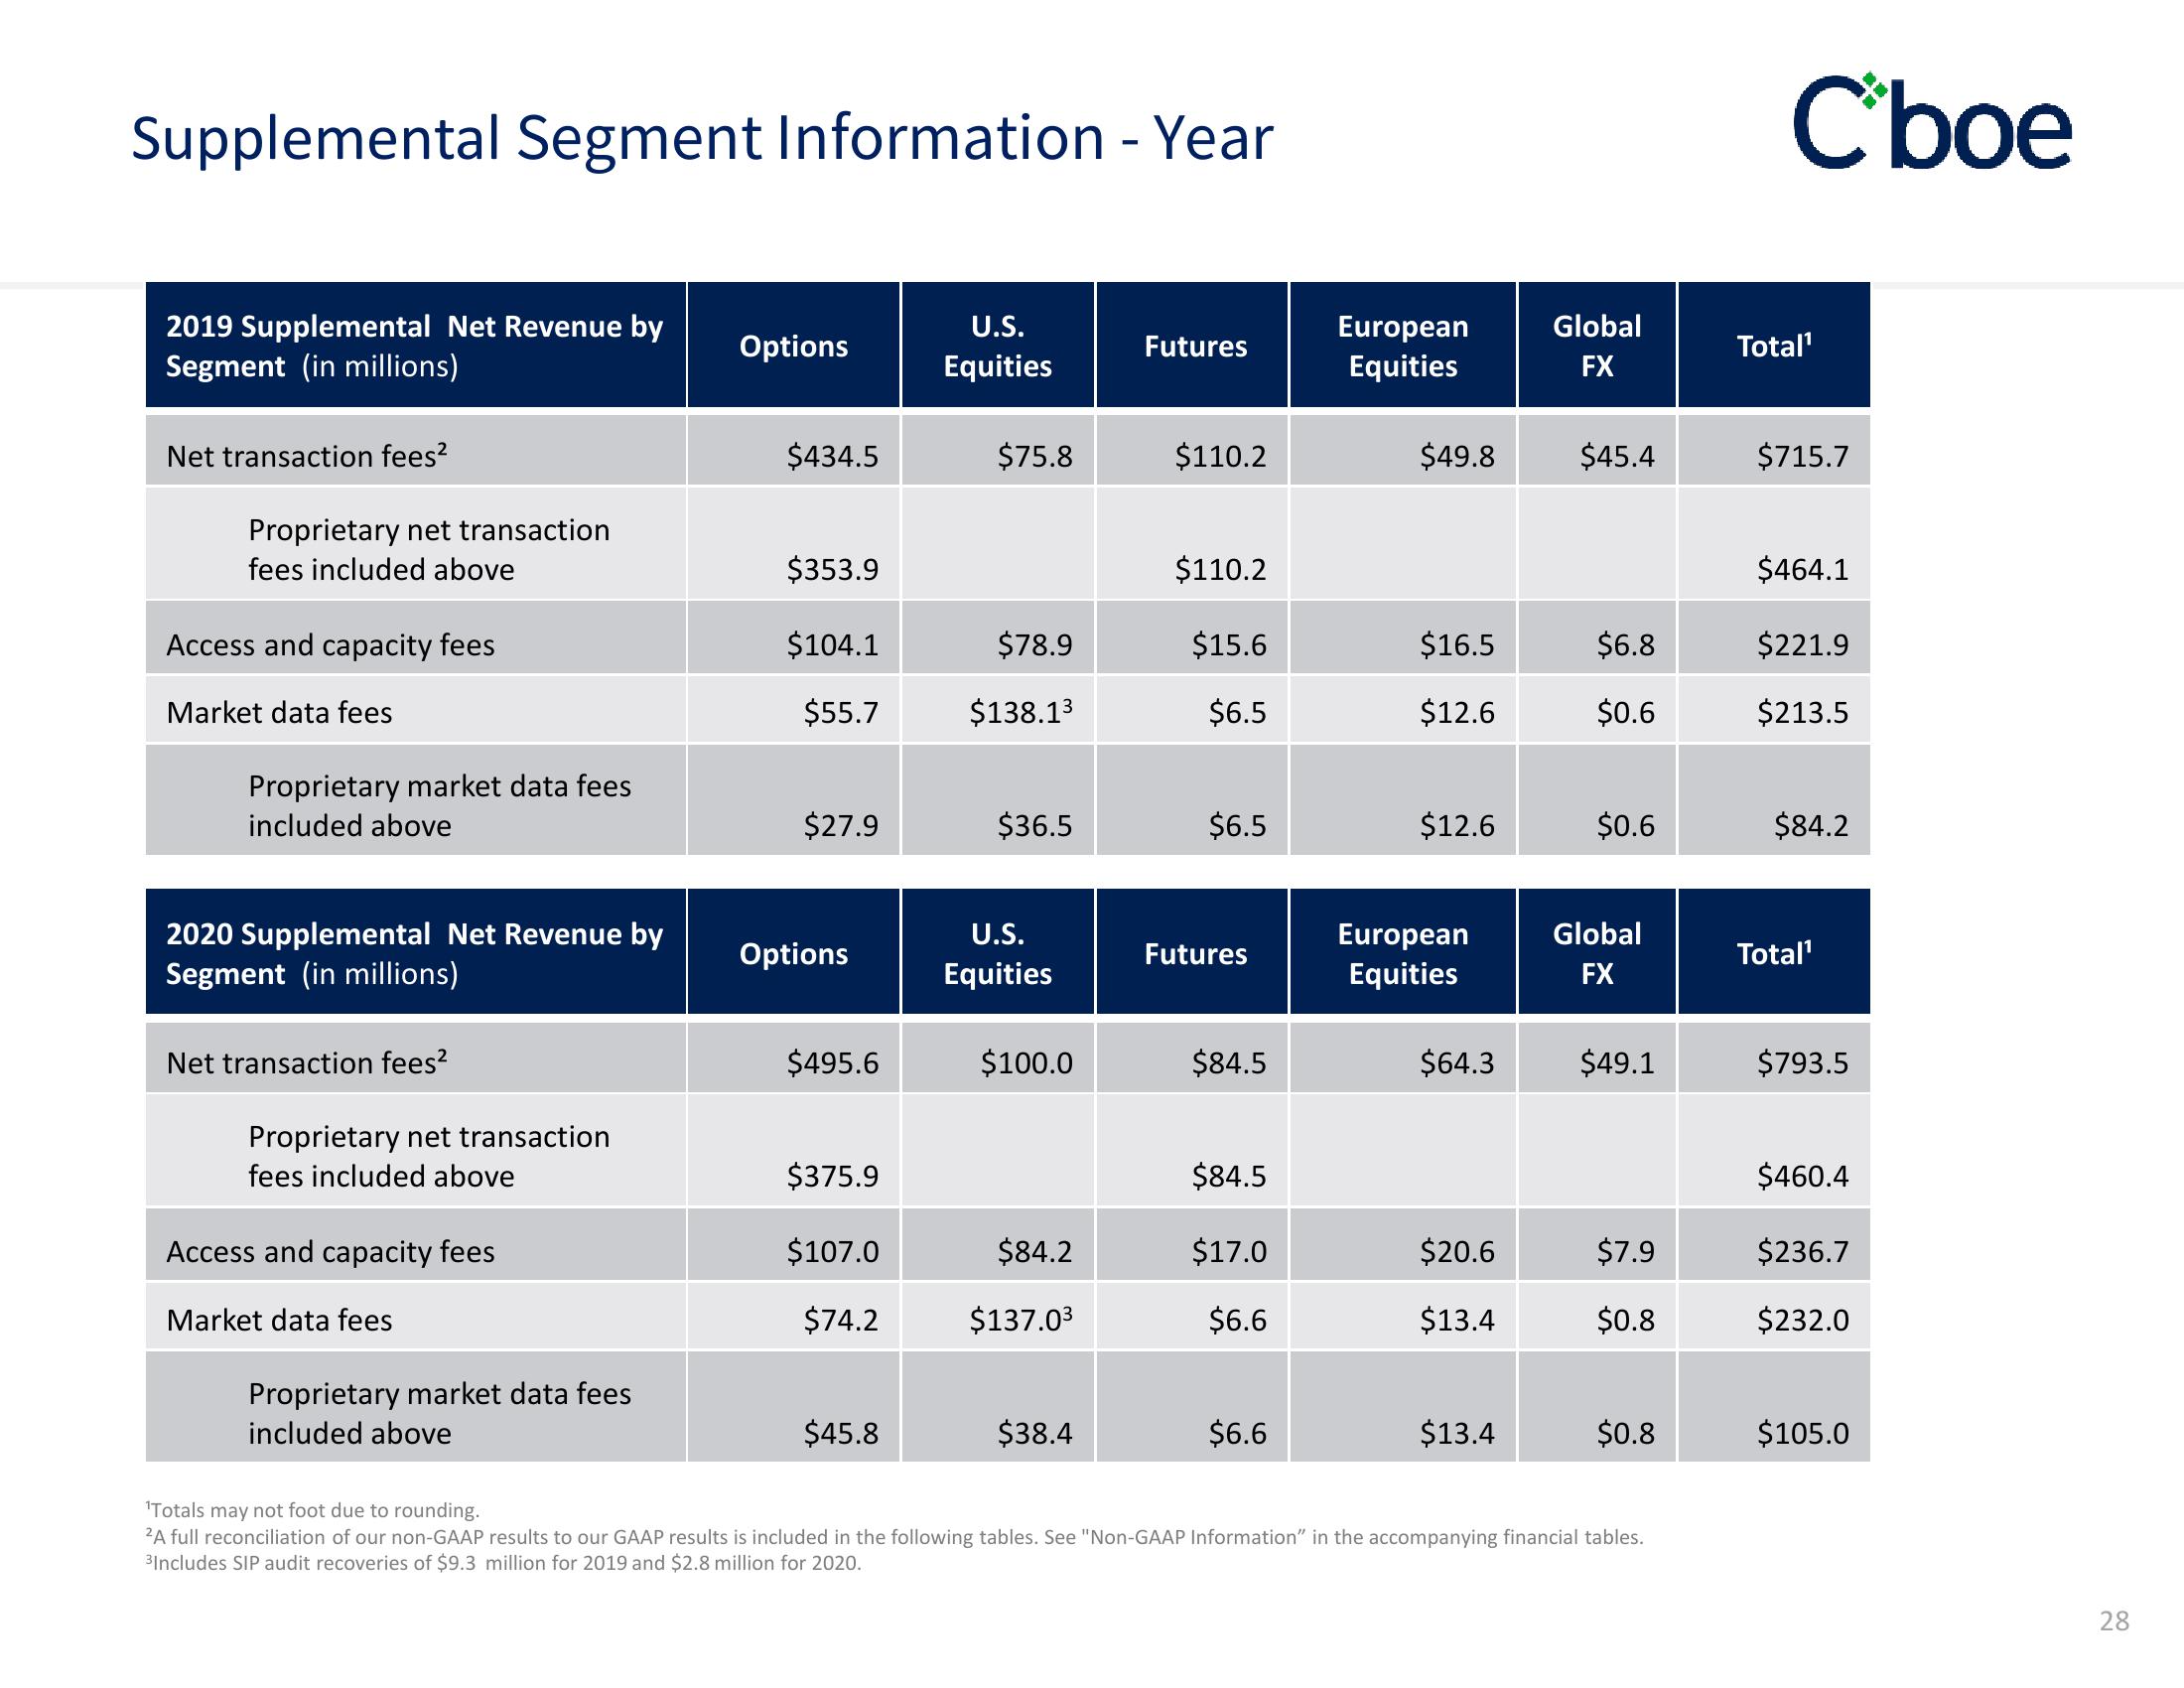
Supplemental Segment Information - Year
2019 Supplemental Net Revenue by
Segment (in millions)
Net transaction fees²
Proprietary net transaction
fees included above
Access and capacity fees
Market data fees
Proprietary market data fees
included above
2020 Supplemental Net Revenue by
Segment (in millions)
Net transaction fees²
Proprietary net transaction
fees included above
Access and capacity fees
Market data fees
Proprietary market data fees
included above
Options
$434.5
$353.9
$104.1
$55.7
$27.9
Options
$495.6
$375.9
$107.0
$74.2
$45.8
U.S.
Equities
$75.8
$78.9
$138.1³
$36.5
U.S.
Equities
$100.0
$84.2
$137.0³
$38.4
Futures
$110.2
$110.2
$15.6
$6.5
$6.5
Futures
$84.5
$84.5
$17.0
$6.6
$6.6
European
Equities
$49.8
$16.5
$12.6
$12.6
European
Equities
$64.3
$20.6
$13.4
$13.4
Global
FX
$45.4
$6.8
$0.6
$0.6
Global
FX
$49.1
$7.9
$0.8
$0.8
¹Totals may not foot due to rounding.
2A full reconciliation of our non-GAAP results to our GAAP results is included in the following tables. See "Non-GAAP Information" in the accompanying financial tables.
³Includes SIP audit recoveries of $9.3 million for 2019 and $2.8 million for 2020.
Cboe
Total¹
$715.7
$464.1
$221.9
$213.5
$84.2
Total¹
$793.5
$460.4
$236.7
$232.0
$105.0
28View entire presentation