Pinterest Results Presentation Deck
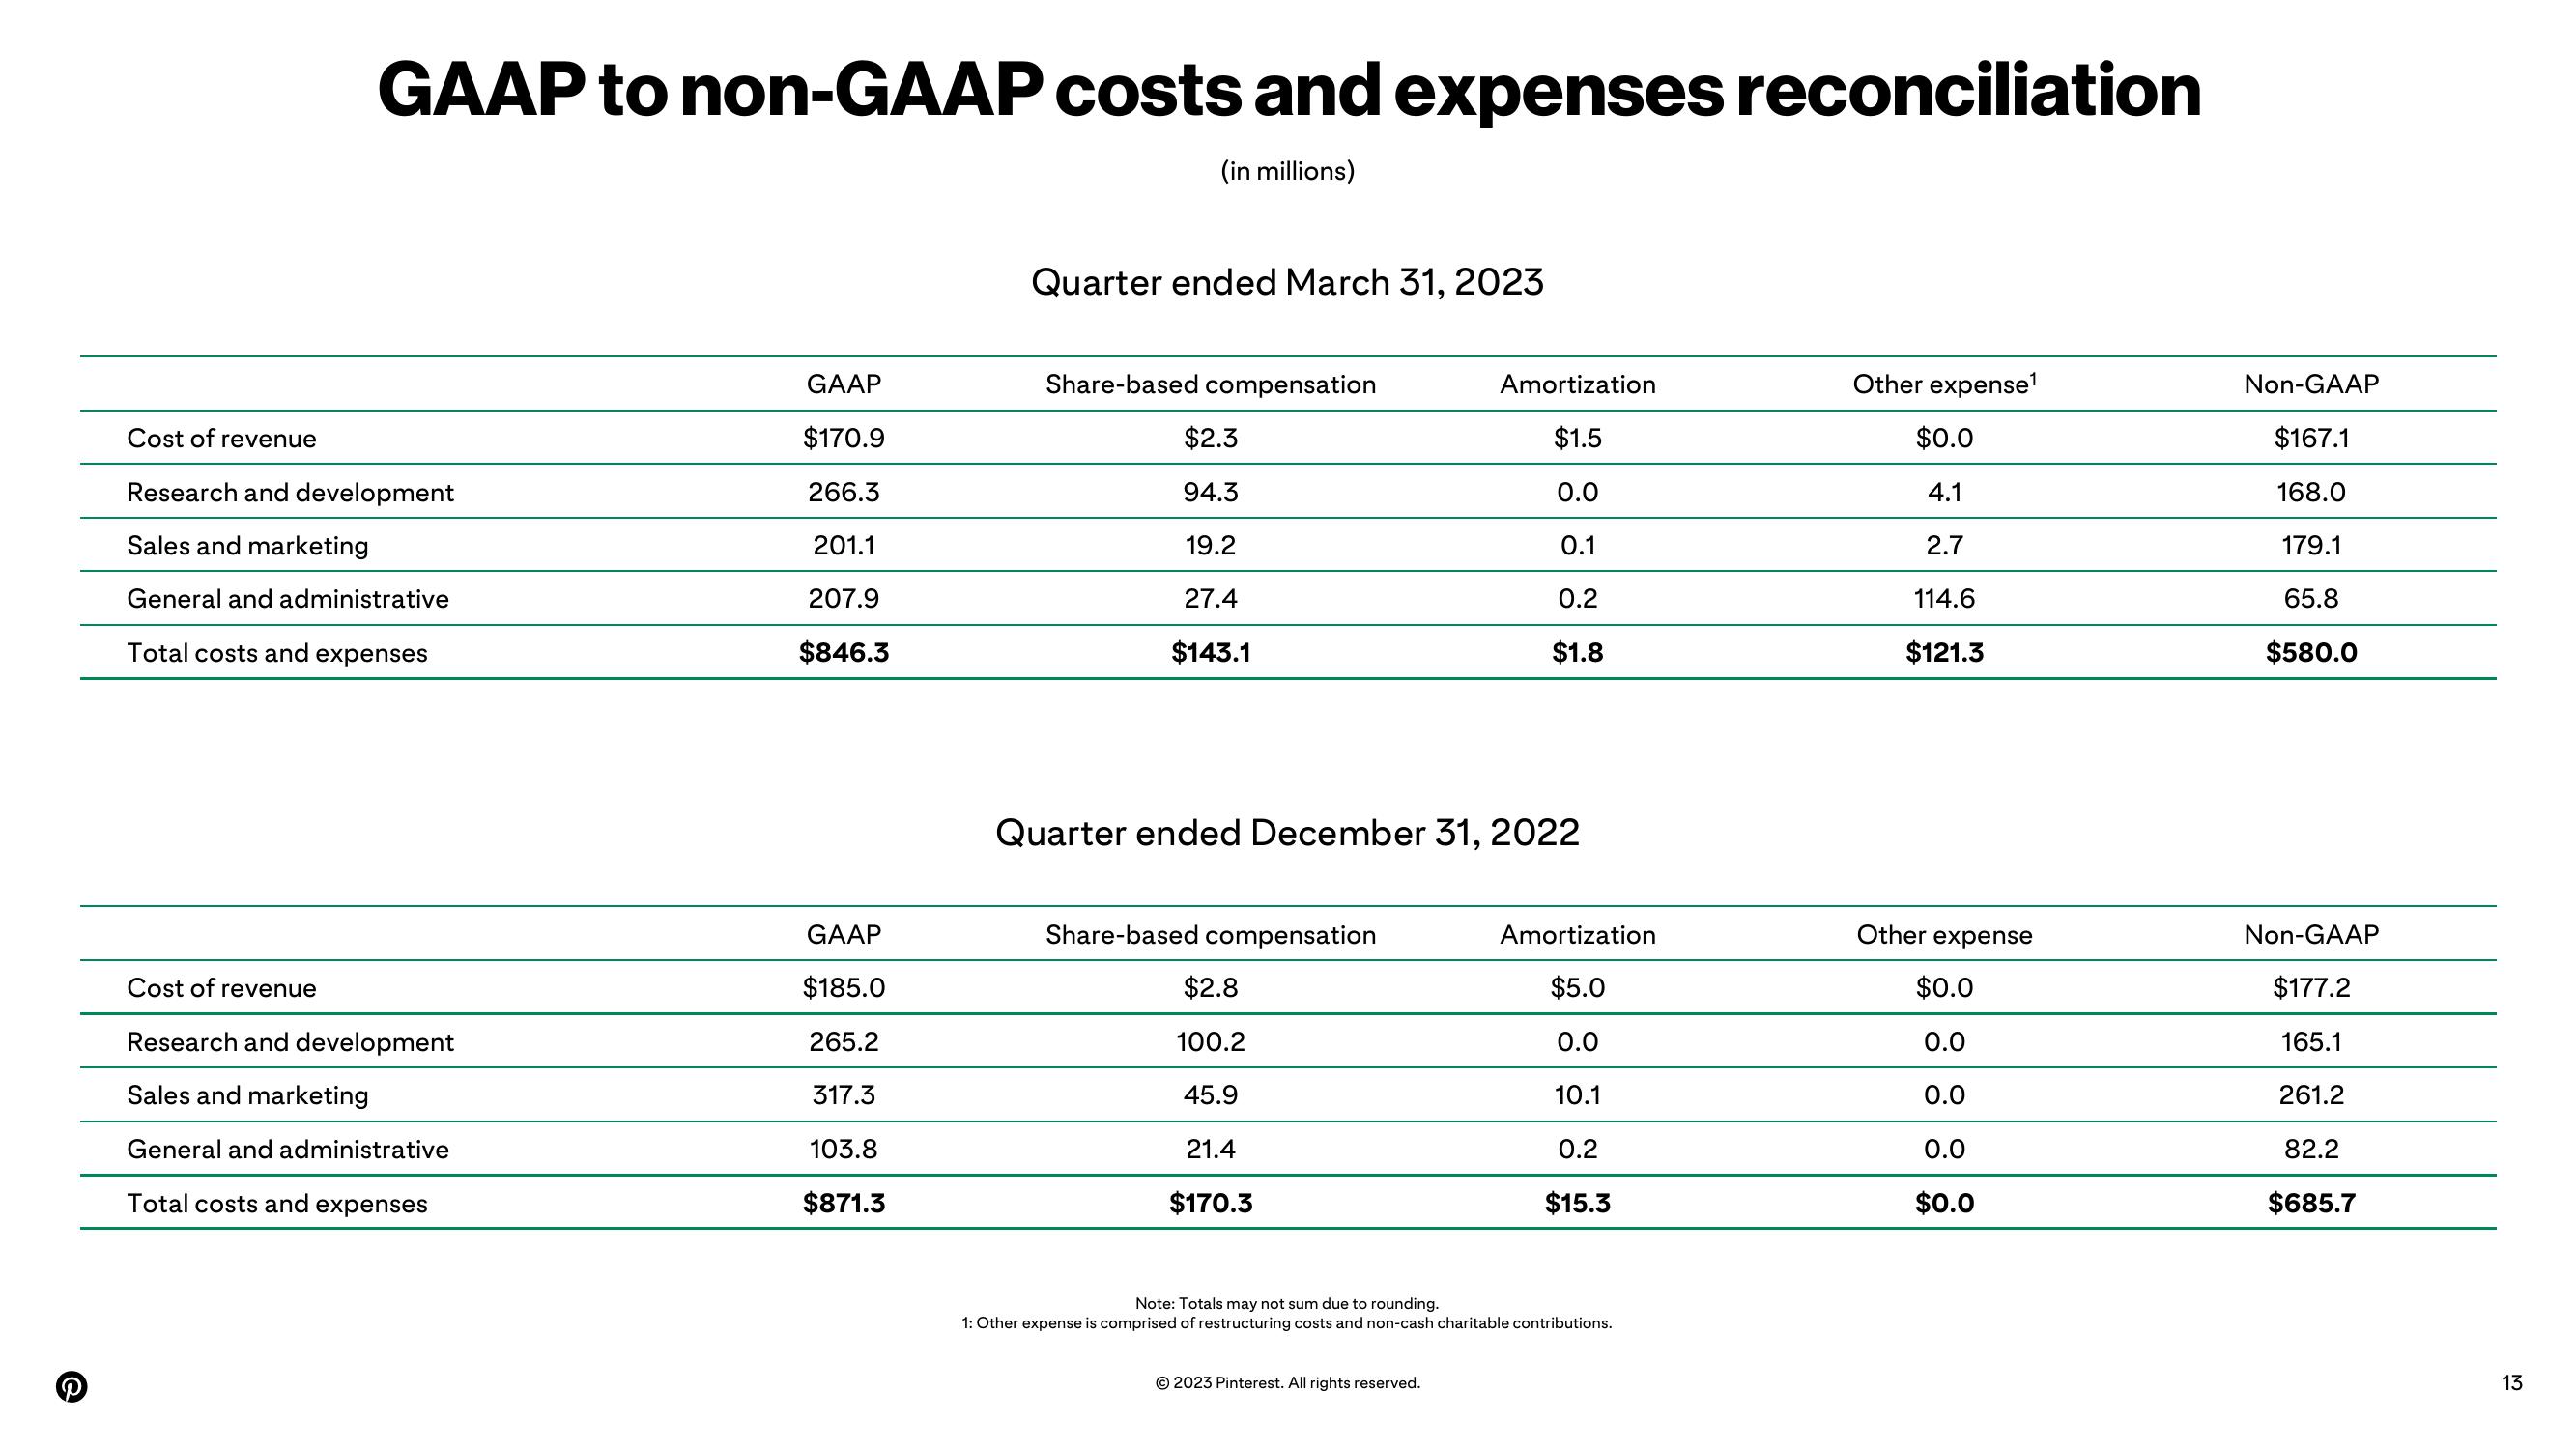
GAAP to non-GAAP costs and expenses reconciliation
(in millions)
Cost of revenue
Research and development
Sales and marketing
General and administrative
Total costs and expenses
Cost of revenue
Research and development
Sales and marketing
General and administrative
Total costs and expenses
GAAP
$170.9
266.3
201.1
207.9
$846.3
GAAP
$185.0
265.2
317.3
103.8
$871.3
Quarter ended March 31, 2023
Share-based compensation
$2.3
94.3
19.2
27.4
$143.1
Quarter ended December 31, 2022
Share-based compensation
$2.8
100.2
45.9
21.4
$170.3
Amortization
$1.5
0.0
0.1
0.2
$1.8
© 2023 Pinterest. All rights reserved.
Amortization
$5.0
0.0
10.1
0.2
$15.3
Note: Totals may not sum due to rounding.
1: Other expense is comprised of restructuring costs and non-cash charitable contributions.
Other expense¹
$0.0
4.1
2.7
114.6
$121.3
Other expense
$0.0
0.0
0.0
0.0
$0.0
Non-GAAP
$167.1
168.0
179.1
65.8
$580.0
Non-GAAP
$177.2
165.1
261.2
82.2
$685.7
13View entire presentation