Annual General Meeting
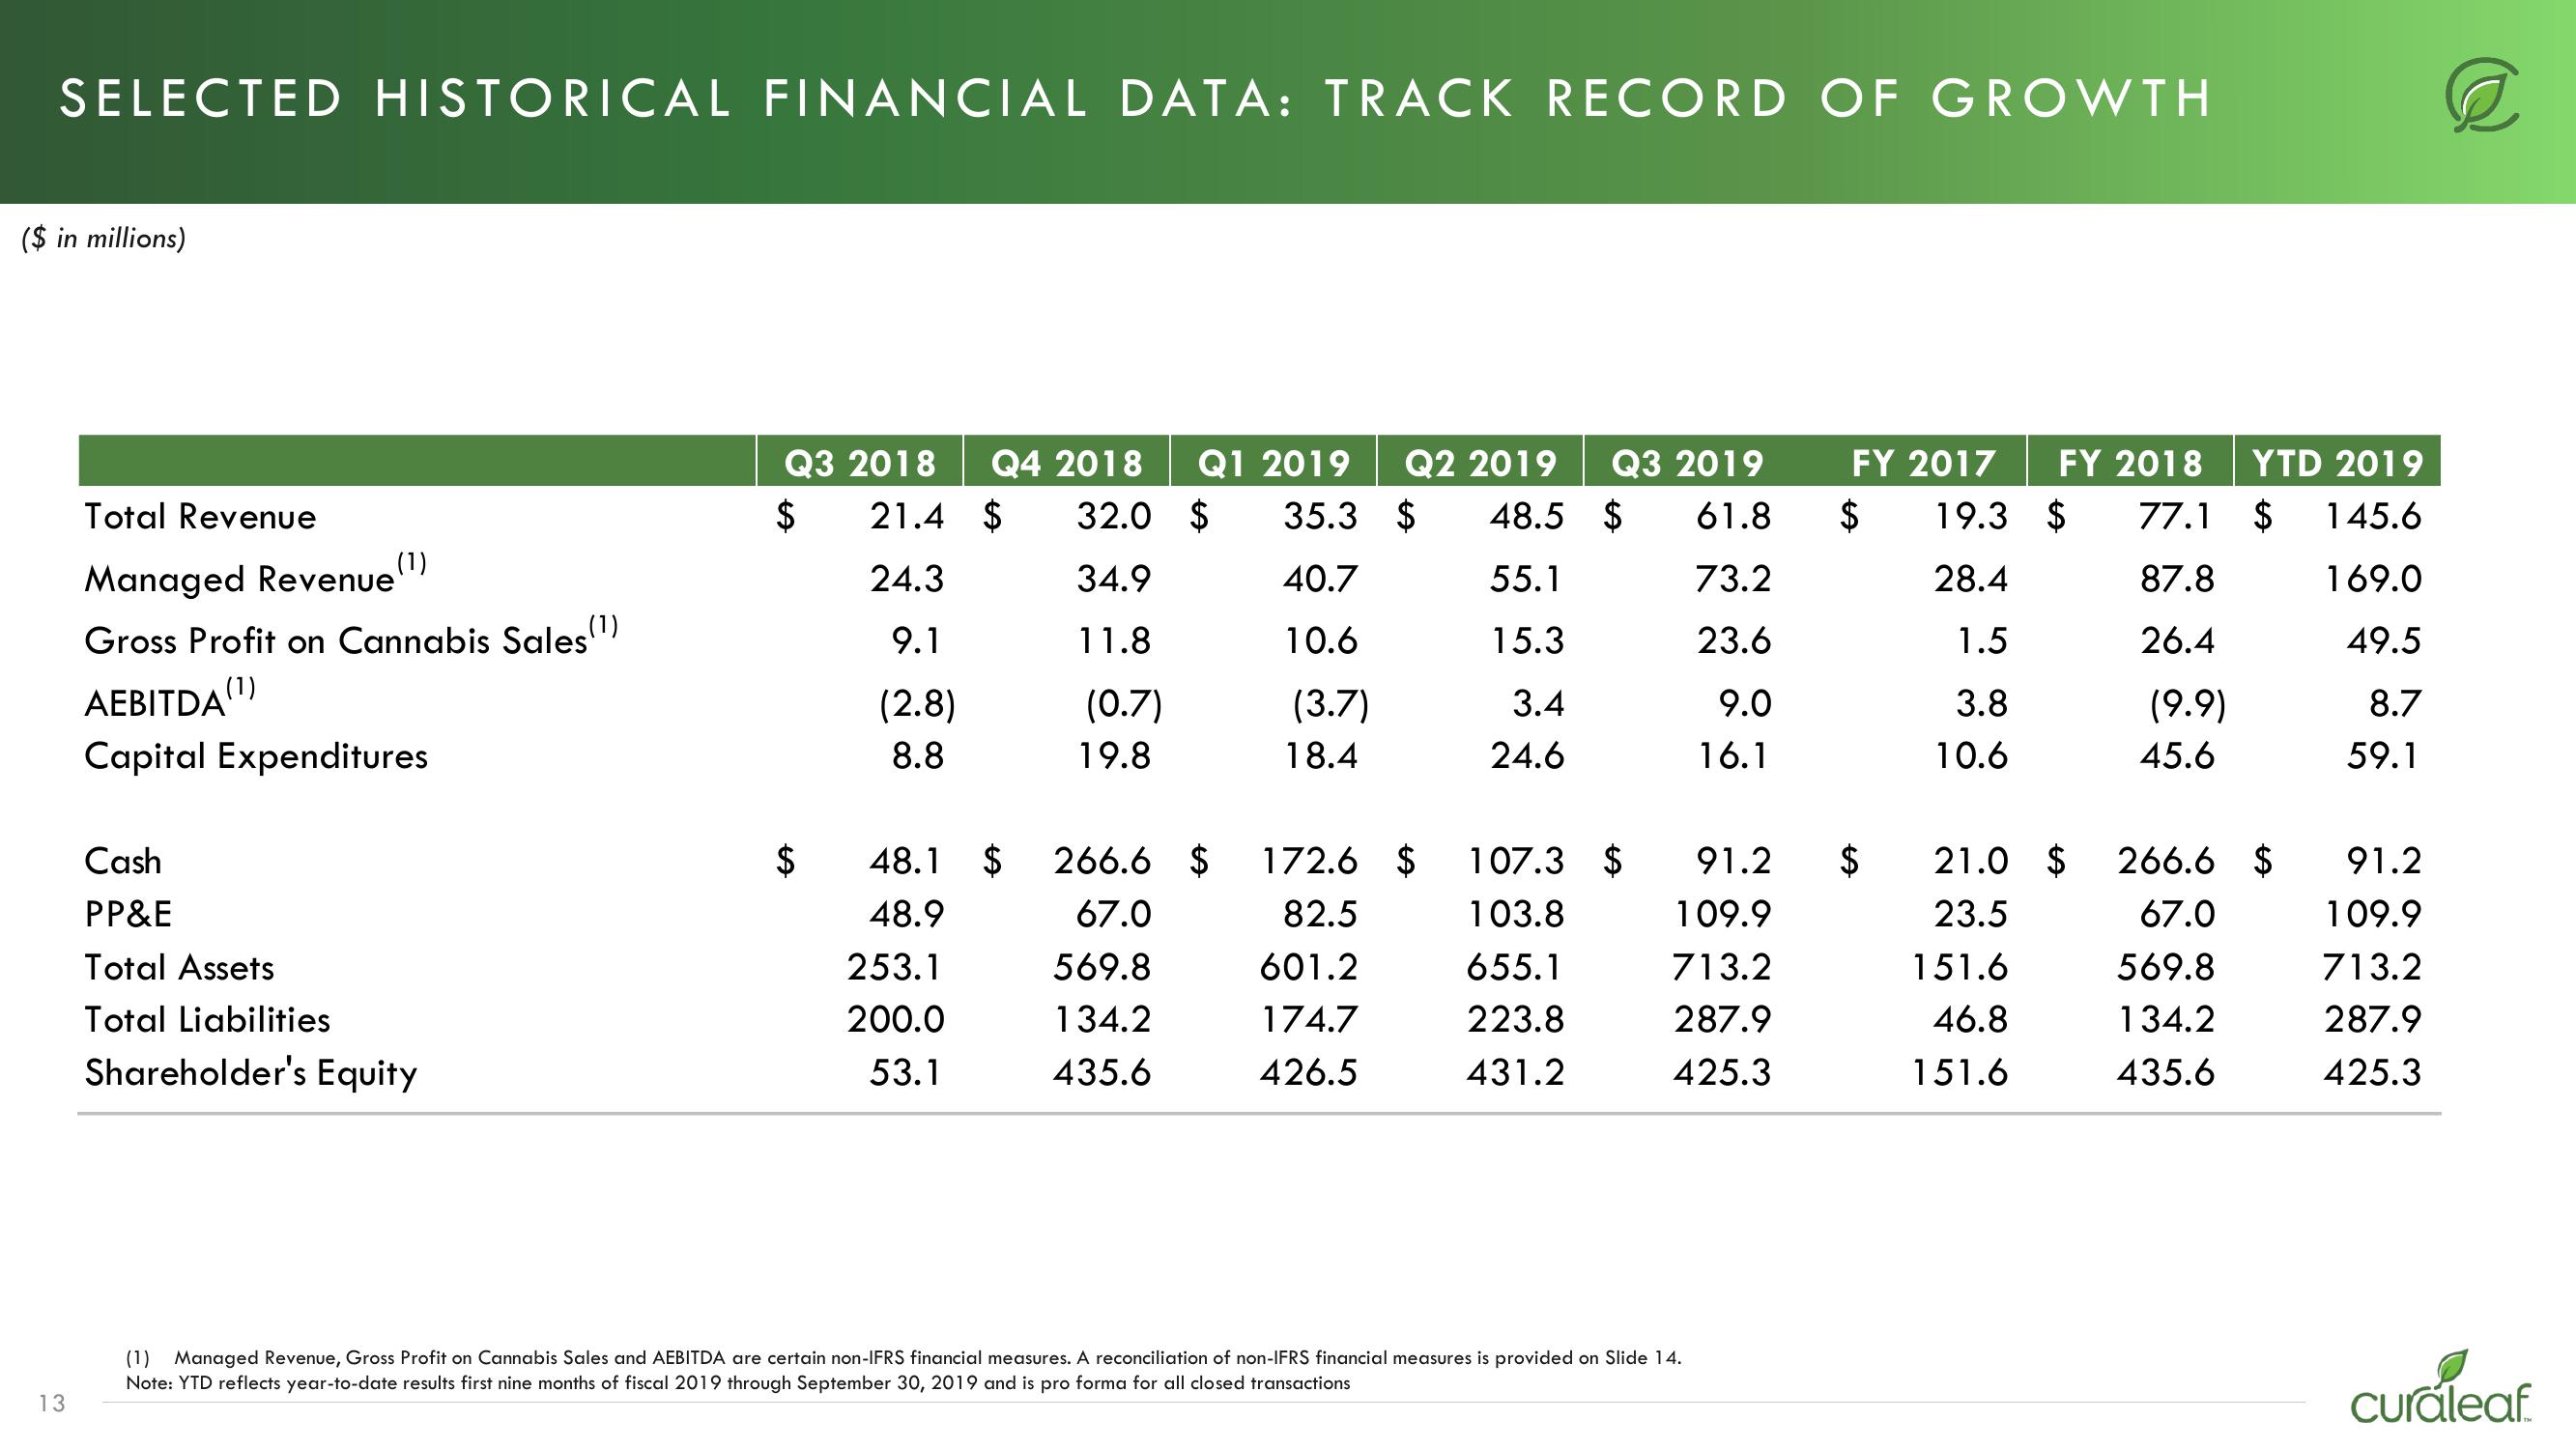
SELECTED HISTORICAL FINANCIAL DATA: TRACK RECORD OF GROWTH
($ in millions)
13
Total Revenue
Managed Revenue (¹)
Gross Profit on Cannabis Sales
(1)
AEBITDA (¹)
Capital Expenditures
Cash
PP&E
Total Assets
Total Liabilities
Shareholder's Equity
Q3 2018 Q4 2018 Q1 2019 Q2 2019 Q3 2019
21.4 $
35.3 $ 48.5 $ 61.8
$
32.0 $
34.9
24.3
40.7
55.1
73.2
9.1
11.8
10.6
15.3
23.6
(2.8)
(0.7)
(3.7)
3.4
9.0
8.8
19.8
18.4
24.6
16.1
GA
48.1 $
48.9
253.1
200.0
53.1
266.6 $
67.0
569.8
134.2
435.6
172.6 $ 107.3 $
82.5
103.8
601.2
655.1
174.7
223.8
426.5
431.2
109.9
713.2
287.9
425.3
(1) Managed Revenue, Gross Profit on Cannabis Sales and AEBITDA are certain non-IFRS financial measures. A reconciliation of non-IFRS financial measures is provided on Slide 14.
Note: YTD reflects year-to-date results first nine months of fiscal 2019 through September 30, 2019 and is pro forma for all closed transactions
FY 2017 FY 2018
$ 19.3 $ 77.1
28.4
87.8
1.5
26.4
3.8
10.6
91.2 $
(9.9)
151.6
46.8
151.6
45.6
YTD 2019
$
145.6
169.0
49.5
8.7
59.1
21.0 $ 266.6 $
23.5
67.0
569.8
134.2
435.6
91.2
109.9
713.2
287.9
425.3
curaleafView entire presentation