Codere SPAC Presentation Deck
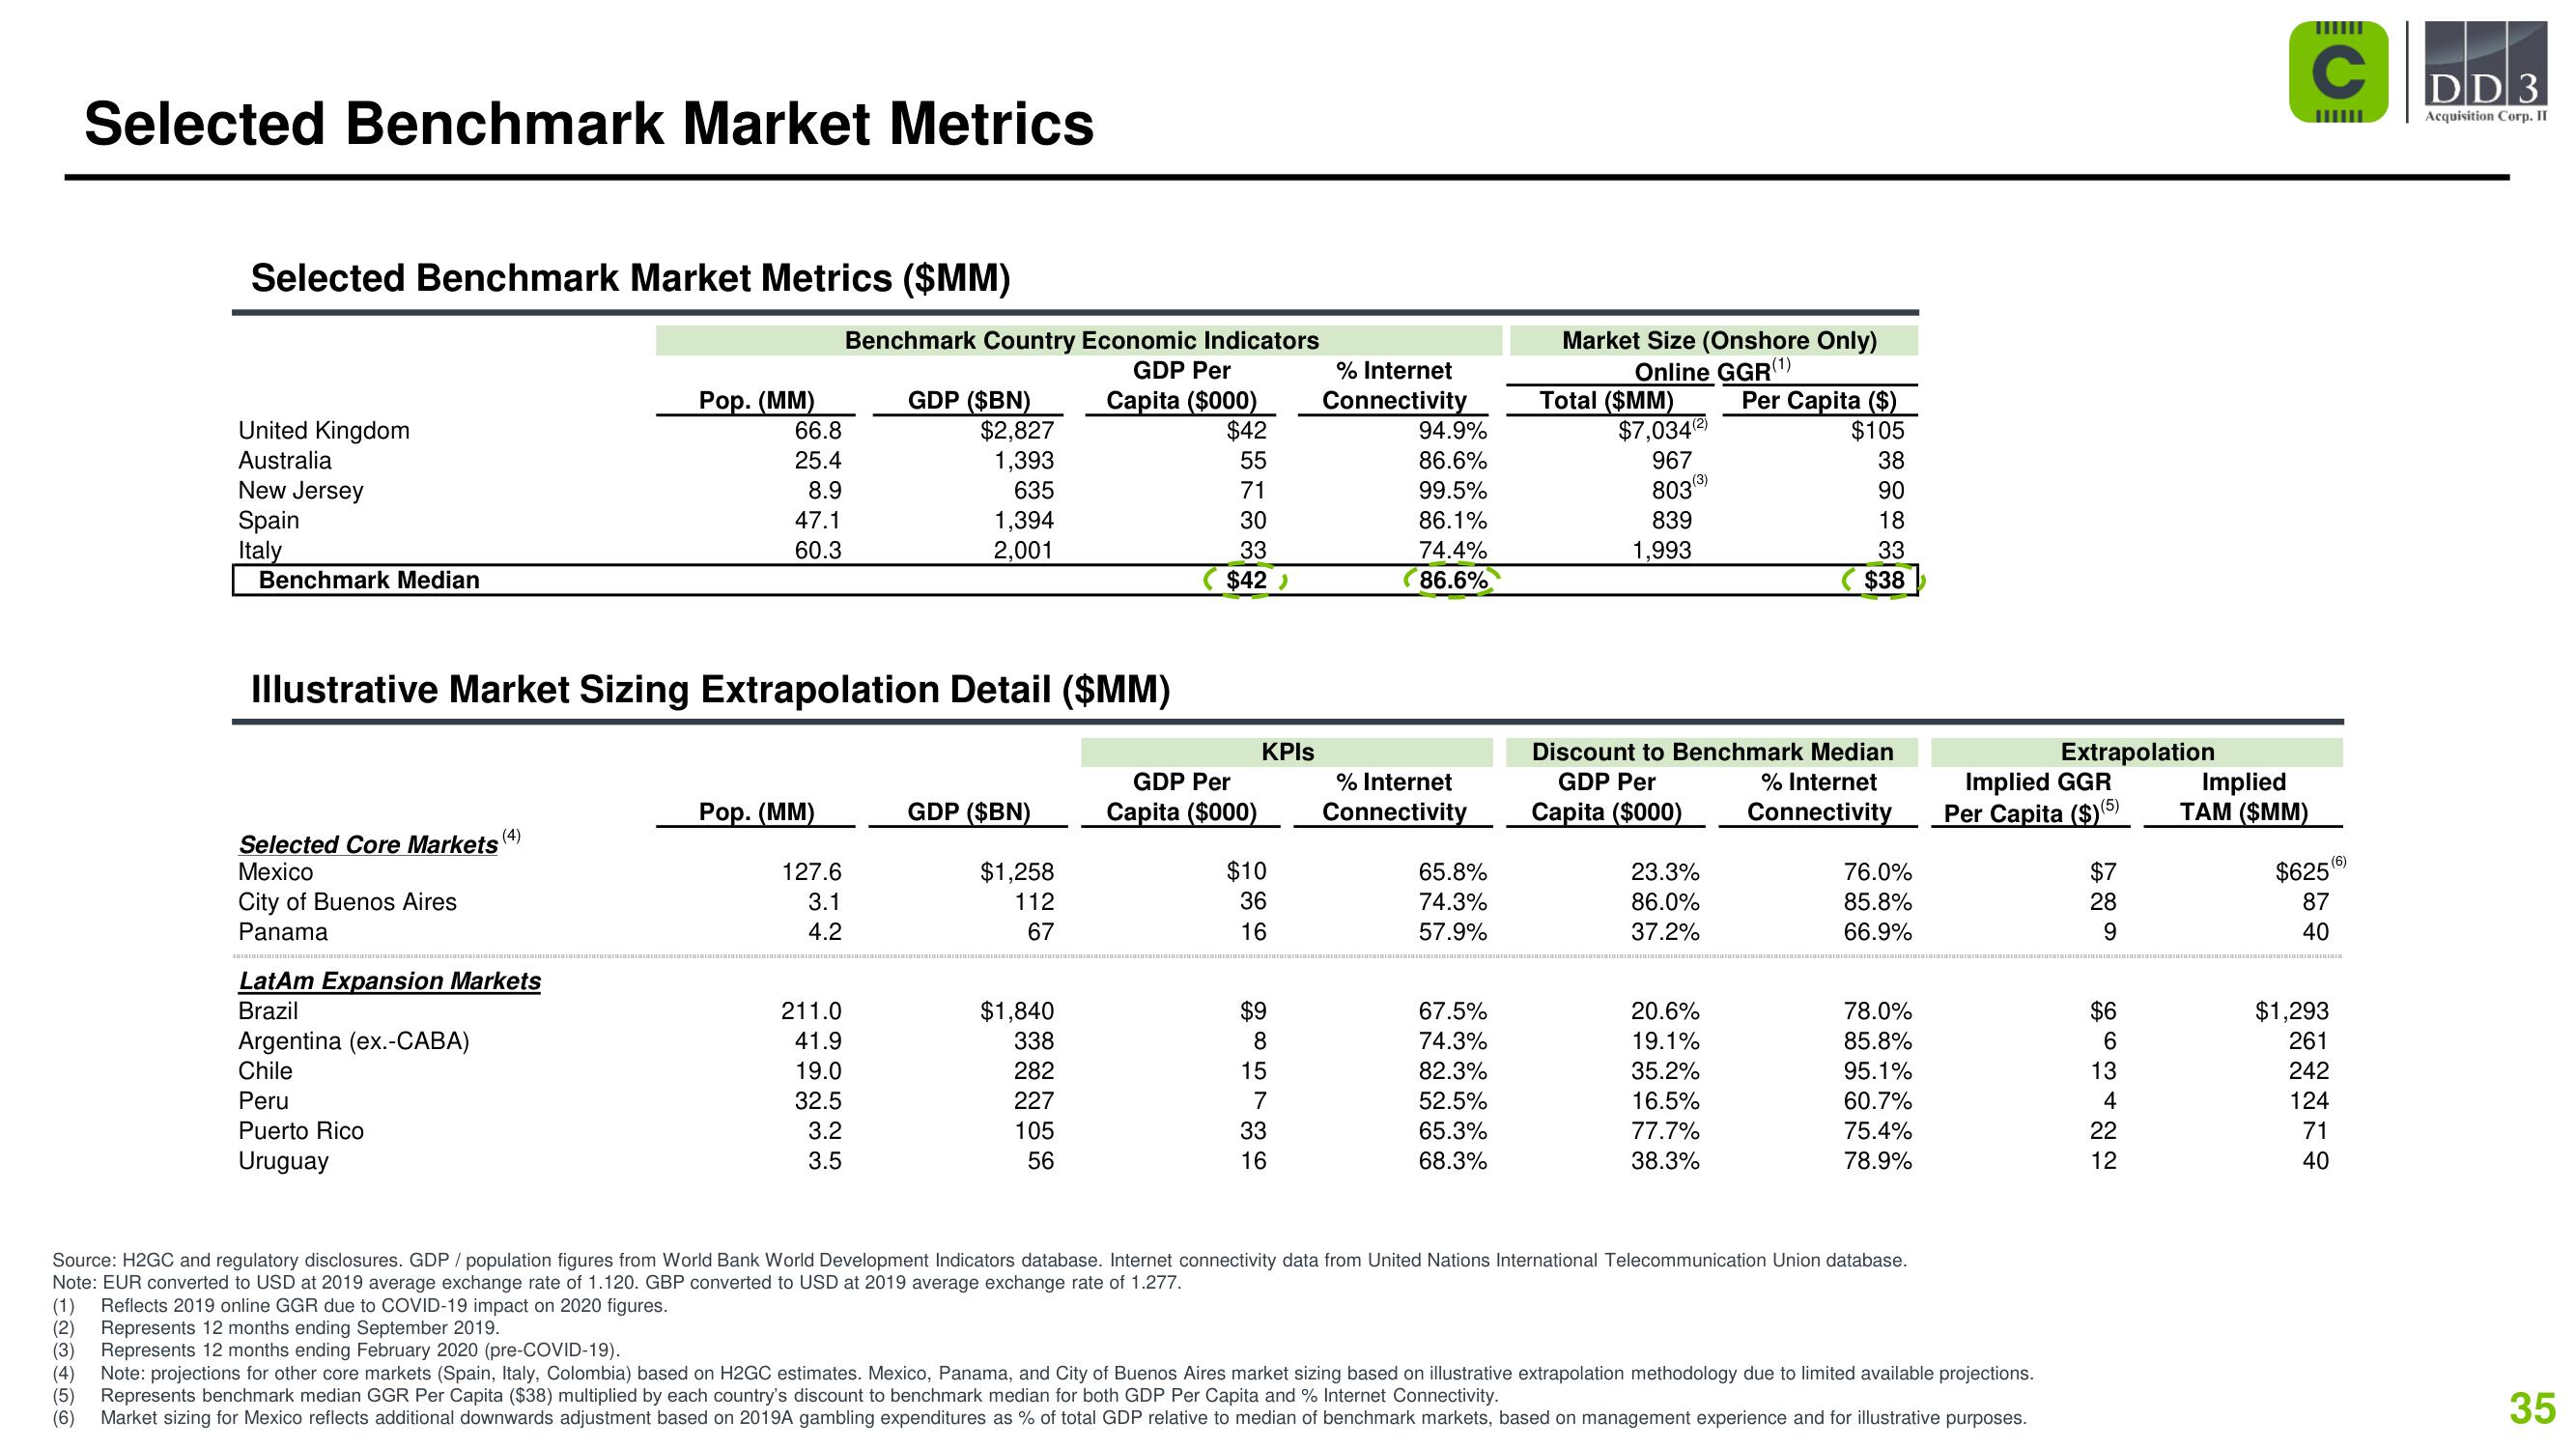
Selected Benchmark Market Metrics
Selected Benchmark Market Metrics ($MM)
United Kingdom
Australia
New Jersey
Spain
Italy
Benchmark Median
Selected Core Markets (4)
Mexico
City of Buenos Aires
Panama
LatAm Expansion Markets
Brazil
Argentina (ex.-CABA)
Chile
Peru
Puerto Rico
Uruguay
Pop. (MM)
Illustrative Market Sizing Extrapolation Detail ($MM)
66.8
25.4
8.9
47.1
60.3
(2)
Represents 12 months ending September 2019.
(3) Represents 12 months ending February 2020 (pre-COVID-19).
Benchmark Country Economic Indicators
GDP Per
Capita ($000)
$42
55
71
30
33
$42)
Pop. (MM)
127.6
3.1
4.2
GDP ($BN)
$2,827
1,393
635
211.0
41.9
19.0
32.5
3.2
3.5
1,394
2,001
GDP ($BN)
$1,258
112
67
$1,840
338
282
227
105
56
GDP Per
Capita ($000)
KPIs
$10
36
16
985736
$9
15
33
16
% Internet
Connectivity
94.9%
86.6%
99.5%
86.1%
74.4%
86.6%
% Internet
Connectivity
65.8%
74.3%
57.9%
67.5%
74.3%
82.3%
52.5%
65.3%
68.3%
Market Size (Onshore Only)
Online GGR (¹)
Total ($MM)
$7,034 (2)
967
803(3)
839
1,993
Discount to Benchmark Median
GDP Per
% Internet
Capita ($000) Connectivity
23.3%
86.0%
37.2%
Per Capita ($)
$105
38
90
18
33
$38
20.6%
19.1%
35.2%
16.5%
77.7%
38.3%
76.0%
85.8%
66.9%
78.0%
85.8%
95.1%
60.7%
75.4%
78.9%
Source: H2GC and regulatory disclosures. GDP / population figures from World Bank World Development Indicators database. Internet connectivity data from United Nations International Telecommunication Union database.
Note: EUR converted to USD at 2019 average exchange rate of 1.120. GBP converted to USD at 2019 average exchange rate of 1.277.
(1) Reflects 2019 online GGR due to COVID-19 impact on 2020 figures.
Extrapolation
Implied GGR
Per Capita ($)(5)
(4) Note: projections for other core markets (Spain, Italy, Colombia) based on H2GC estimates. Mexico, Panama, and City of Buenos Aires market sizing based on illustrative extrapolation methodology due to limited available projections.
(5) Represents benchmark median GGR Per Capita ($38) multiplied by each country's discount to benchmark median for both GDP Per Capita and % Internet Connectivity.
(6) Market sizing for Mexico reflects additional downwards adjustment based on 2019A gambling expenditures as % of total GDP relative to median of benchmark markets, based on management experience and for illustrative purposes.
$7
28
9
663422
$6
13
12
Implied
TAM ($MM)
с
(6)
$625
87
40
$1,293
261
242
124
71
40
DD 3
Acquisition Corp. II
35View entire presentation