MoneyLion Results Presentation Deck
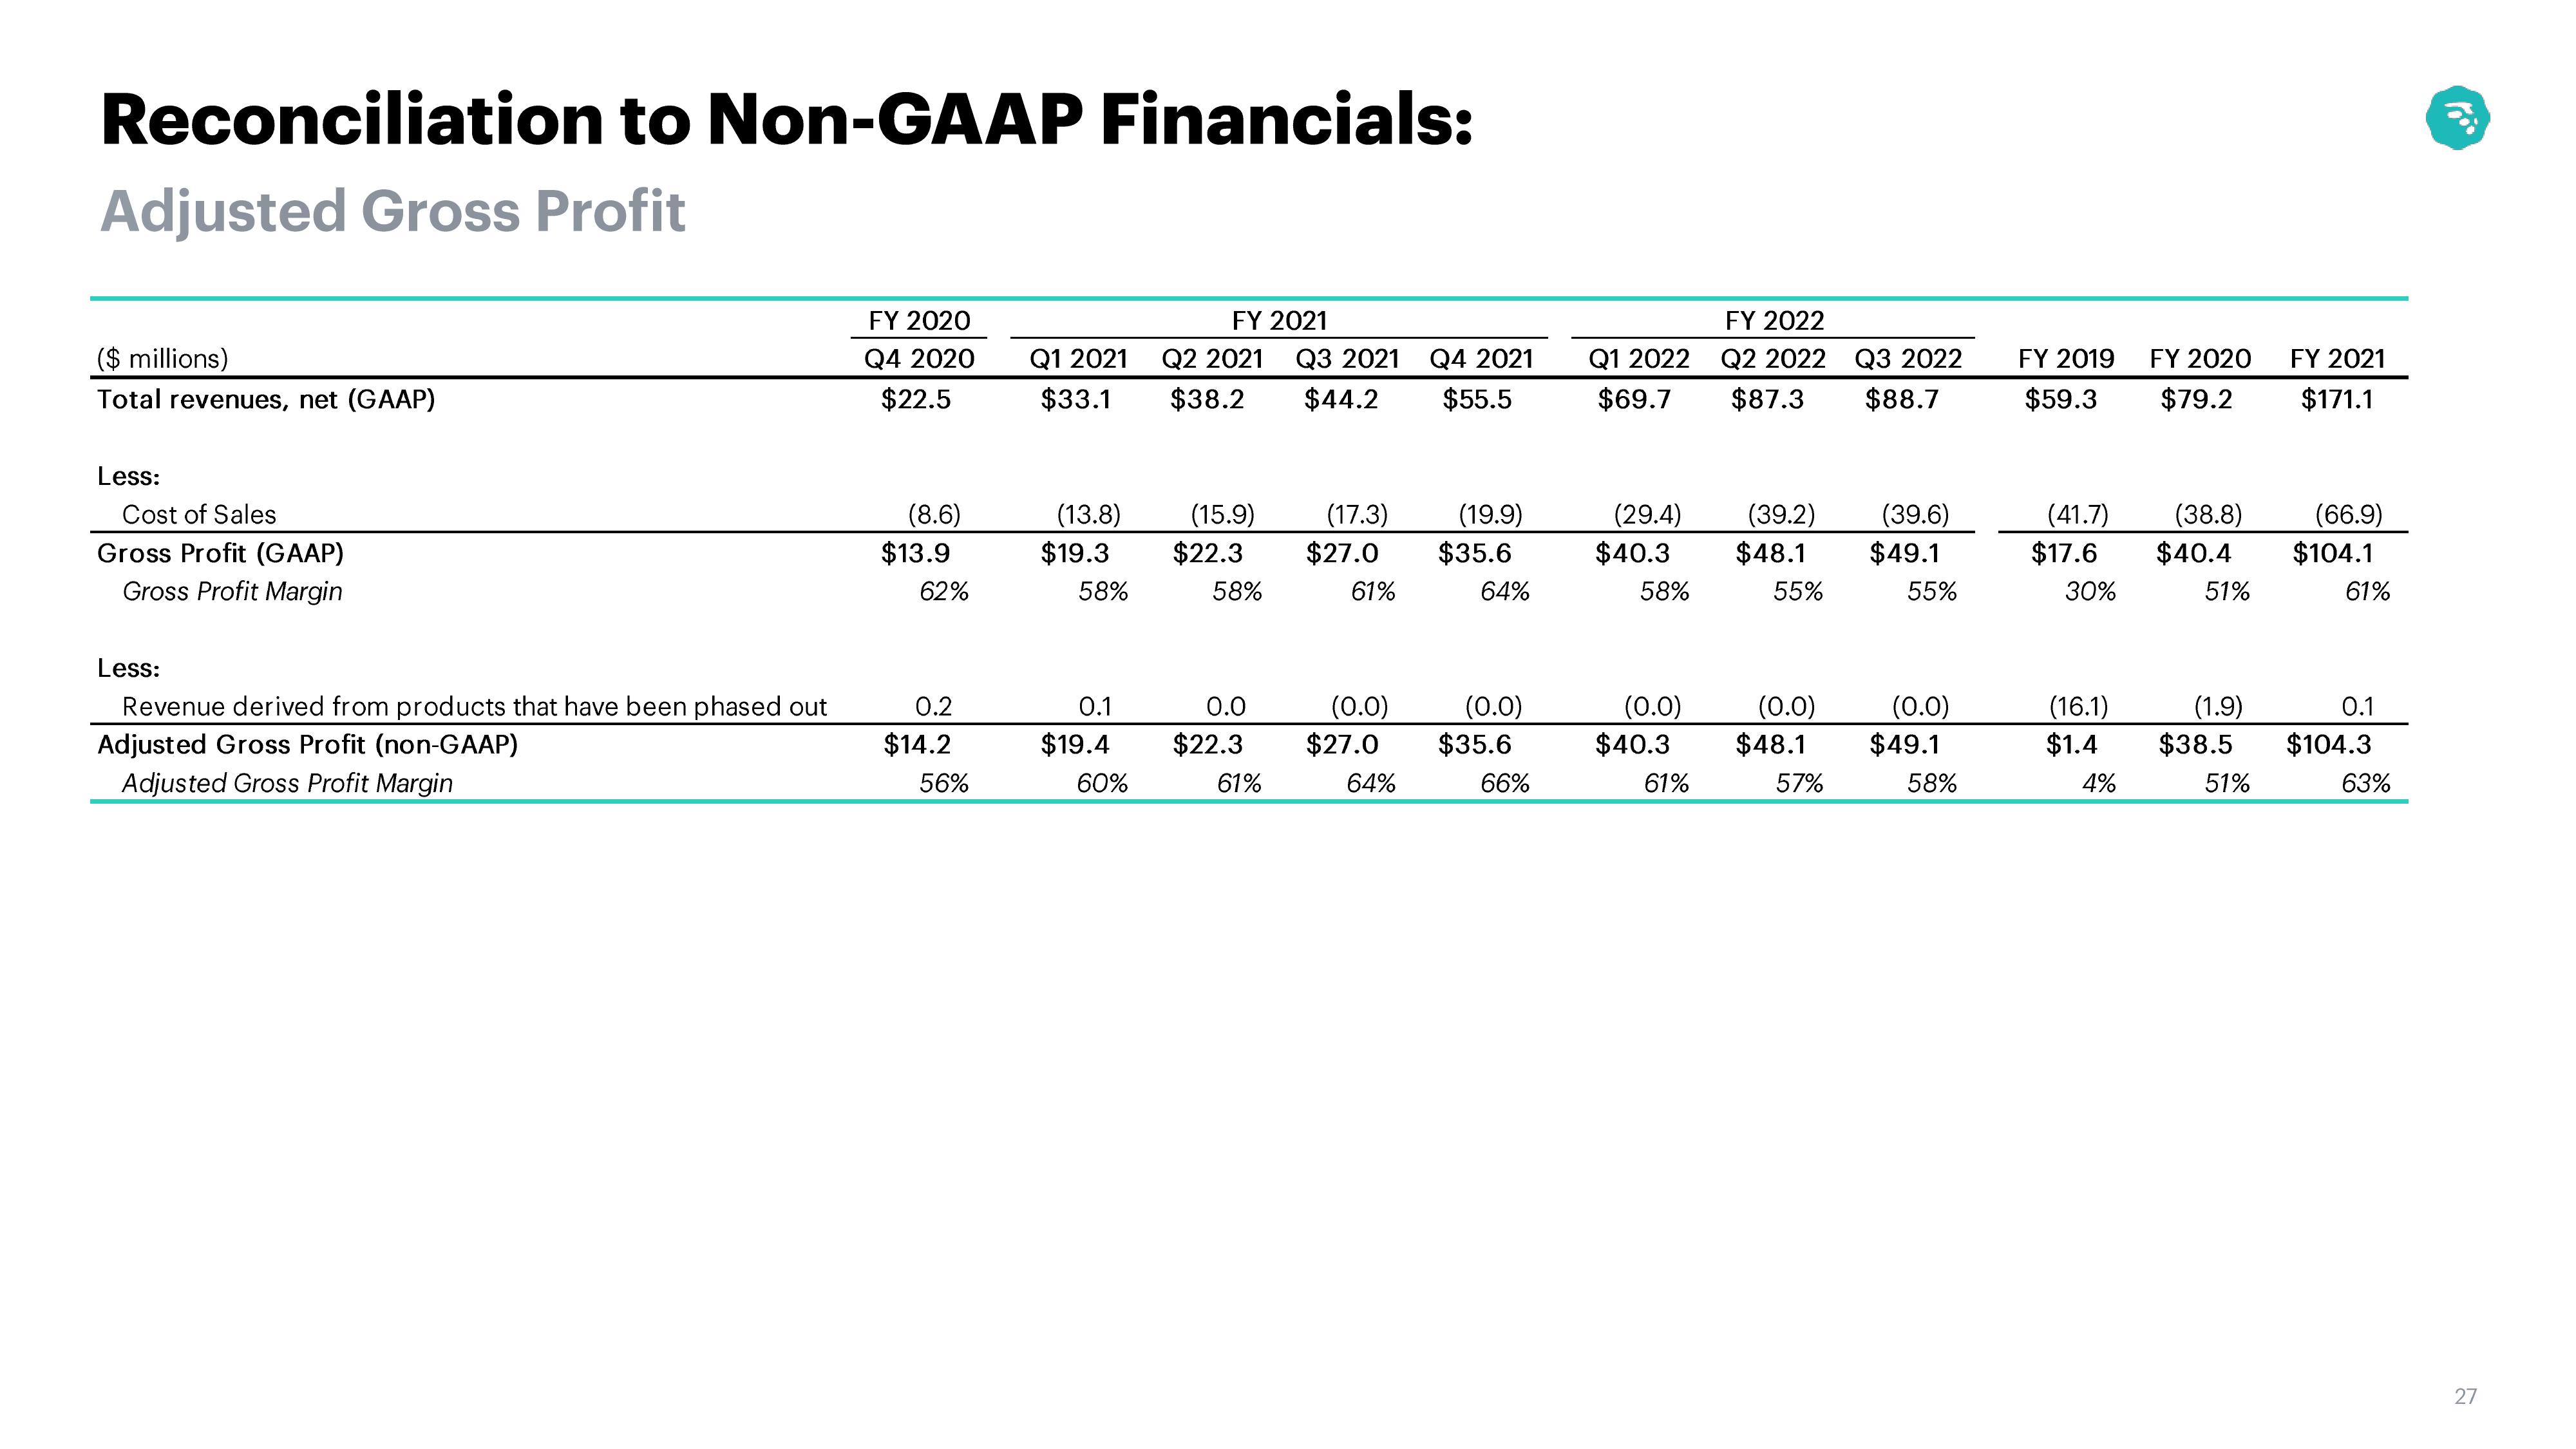
Reconciliation to Non-GAAP Financials:
Adjusted Gross Profit
($ millions)
Total revenues, net (GAAP)
Less:
Cost of Sales
Gross Profit (GAAP)
Gross Profit Margin
Less:
Revenue derived from products that have been phased out
Adjusted Gross Profit (non-GAAP)
Adjusted Gross Profit Margin
FY 2020
Q4 2020
$22.5
(8.6)
$13.9
62%
0.2
$14.2
56%
FY 2021
Q1 2021 Q2 2021 Q3 2021
$38.2 $44.2
$33.1
(13.8)
$19.3
58%
0.1
$19.4
60%
(15.9)
$22.3
58%
(17.3)
$27.0
61%
0.0
(0.0)
$22.3 $27.0
61%
64%
Q4 2021
$55.5
(19.9)
$35.6
64%
(0.0)
$35.6
66%
FY 2022
Q1 2022 Q2 2022
$69.7 $87.3
(29.4)
$40.3
58%
(0.0)
$40.3
61%
(39.6)
(39.2)
$48.1 $49.1
55%
55%
(0.0)
$48.1
Q3 2022
$88.7
57%
(0.0)
$49.1
58%
FY 2019
$59.3
(41.7)
$17.6
30%
FY 2020
$79.2
(38.8)
$40.4
51%
(16.1) (1.9)
$1.4 $38.5
4%
51%
FY 2021
$171.1
(66.9)
$104.1
61%
0.1
$104.3
63%
1⁰⁰0
27View entire presentation