Sonos Results Presentation Deck
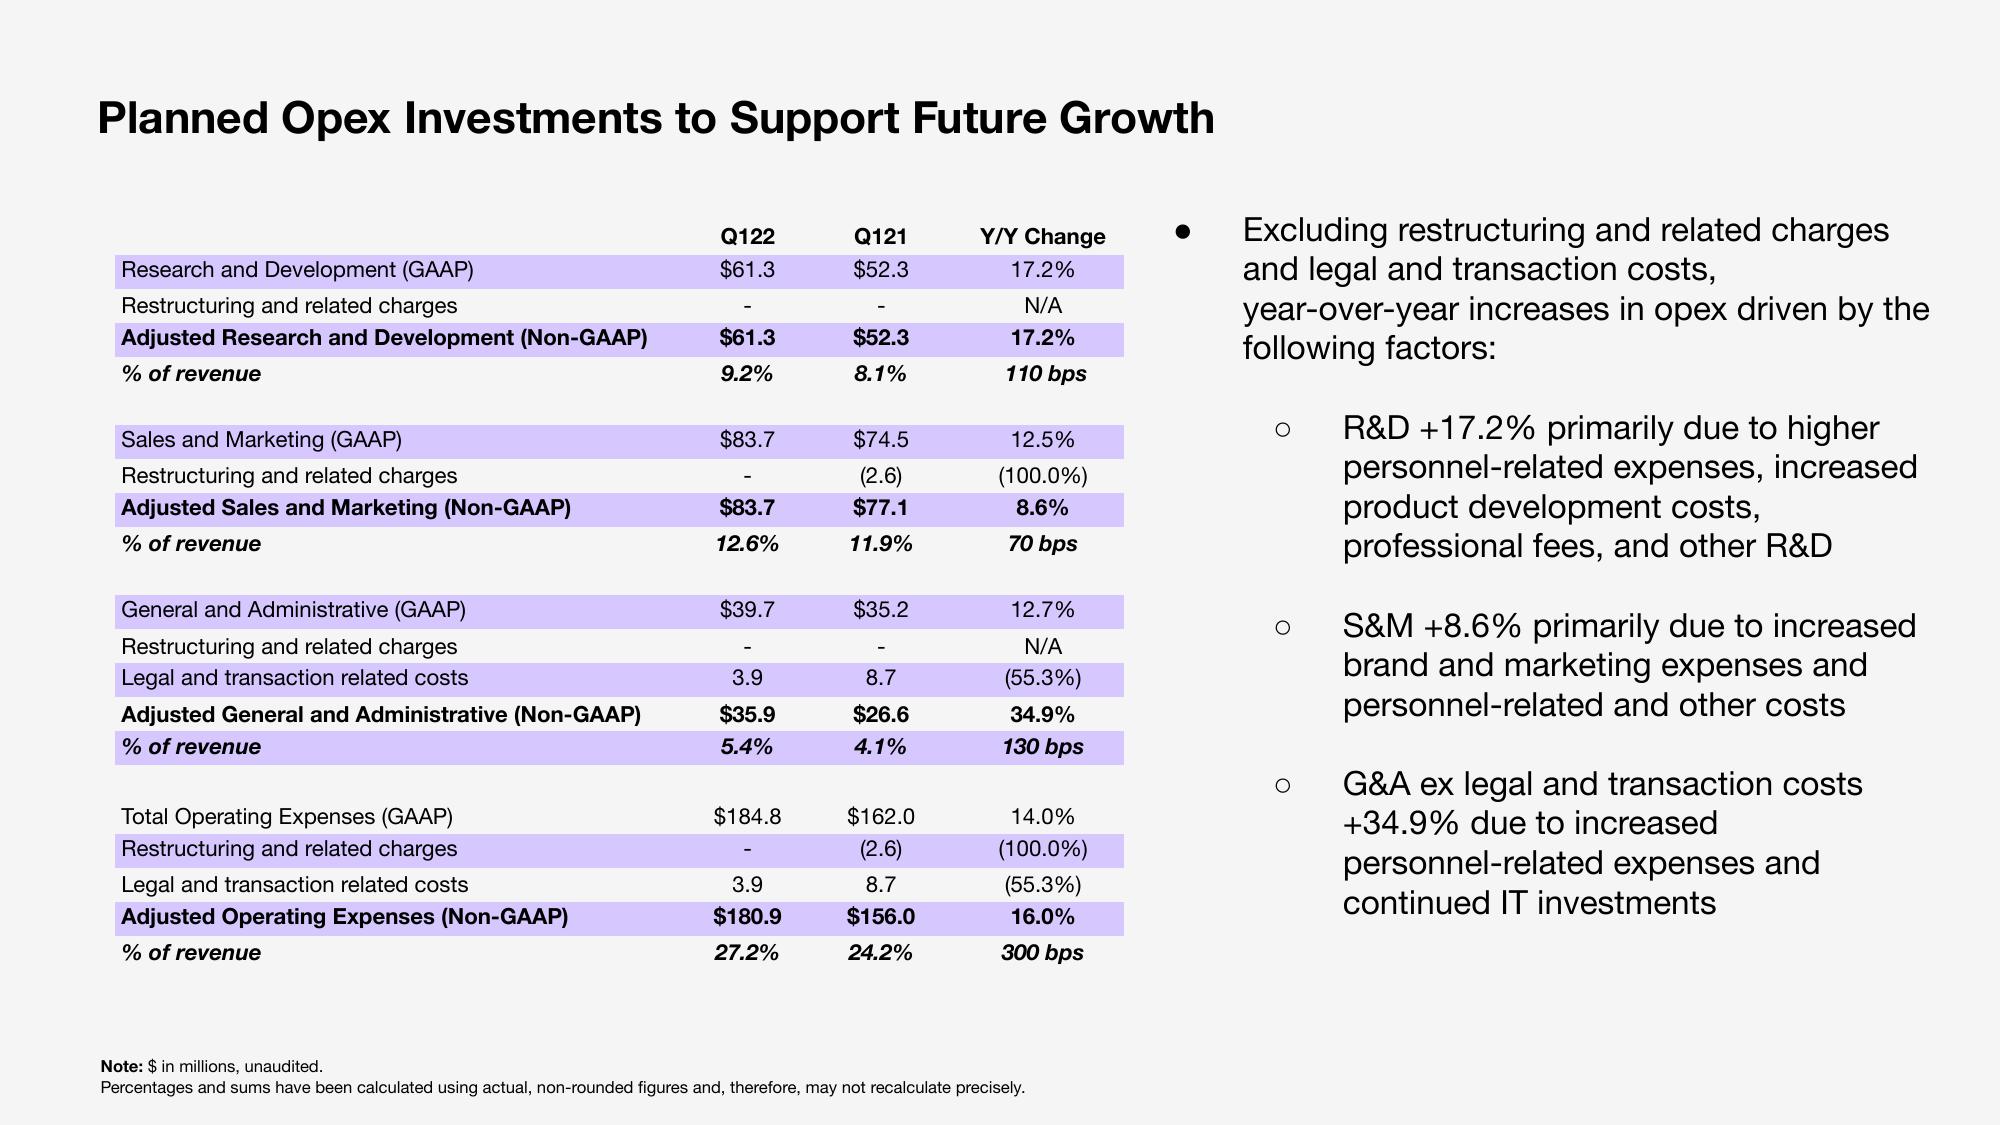
Planned Opex Investments to Support Future Growth
Research and Development (GAAP)
Restructuring and related charges
Adjusted Research and Development (Non-GAAP)
% of revenue
Sales and Marketing (GAAP)
Restructuring and related charges
Adjusted Sales and Marketing (Non-GAAP)
% of revenue
General and Administrative (GAAP)
Restructuring and related charges
Legal and transaction related costs
Adjusted General and Administrative (Non-GAAP)
% of revenue
Total Operating Expenses (GAAP)
Restructuring and related charges
Legal and transaction related costs
Adjusted Operating Expenses (Non-GAAP)
% of revenue
Q122
$61.3
$61.3
9.2%
$83.7
$83.7
12.6%
$39.7
3.9
$35.9
5.4%
$184.8
3.9
$180.9
27.2%
Q121
$52.3
$52.3
8.1%
$74.5
(2.6)
$77.1
11.9%
$35.2
8.7
$26.6
4.1%
$162.0
(2.6)
8.7
$156.0
24.2%
Y/Y Change
17.2%
N/A
17.2%
110 bps
12.5%
(100.0%)
8.6%
70 bps
12.7%
N/A
(55.3%)
34.9%
130 bps
14.0%
(100.0%)
(55.3%)
16.0%
300 bps
Note: $ in millions, unaudited.
Percentages and sums have been calculated using actual, non-rounded figures and, therefore, may not recalculate precisely.
Excluding restructuring and related charges
and legal and transaction costs,
year-over-year increases in opex driven by the
following factors:
R&D +17.2% primarily due to higher
personnel-related expenses, increased
product development costs,
professional fees, and other R&D
O S&M +8.6% primarily due to increased
brand and marketing expenses and
personnel-related and other costs
O
G&A ex legal and transaction costs
+34.9% due to increased
personnel-related expenses and
continued IT investmentsView entire presentation